
 Our analysis shows that House Democrats didn’t suffer for voting for cap-and-trade more than they might have otherwise, even though some champions of the bill, such as Rep. Rich Boucher (Va.), were defeated Tuesday.Photo: Boucher for CongressCross-posted from ScienceBlogs.
There’s been some debate among the climate hawks about last night’s election returns. Politico posted a story suggesting that the toll was especially hard on Democrats who supported the landmark climate change legislation passed by the House last summer. Kate Sheppard observed that quite a few of the Democrats who opposed the bill also lost their seats, and Chris Mims (formerly of ScienceBlogs, now at Grist) argued that the election wasn’t a referendum on climate change, pointing to the significant numbers of bill supporters who survived last night. NRDC found the same thing.
The tricky thing about just looking at the raw numbers is that some of the people who lost last night would have lost no matter how they voted, while others might have held their seat if they had voted differently. Most of the Democrats who supported the bill would never have lost re-election. Rep. Rick Boucher (Va.) is the foremost example of a Democrat who lost because of his vote on the bill, with his former chief of staff arguing compellingly that Boucher’s aggressive work to pass the bill was the main thing that caused his coal-economy constituents to drop him. But he didn’t just vote for the bill, he actively negotiated to pass it, and that’s different.
To really get at this issue, we have to do some statistical analysis. The hypothesis we’re testing is straightforward: whether representatives who voted for the climate change bill performed worse in this election than they should have.
Using Charlie Cook’s Partisan Voting Index as a basic proxy for the underlying politics of the district (a statistic measuring the partisan trend in a district based on previous presidential races), I ran a series of regressions against the fraction of the vote going to the Democrat in each House district, as reported at The New York Times (for statistical reasons, I left out races with no Democratic candidate, no Republican challenger, or where the Democrat got less than 10 percent or more than 90 percent of the vote). As you’d expect, the regression is highly predictive, with the regression explaining 85 percent of the variability. Adding in information on the party of the representative raises that predictive power to 90 percent (by accounting for some of the effects of incumbency).
I then added two variables: the vote on final passage of the Affordable Care Act (the 2010 healthcare bill), and the vote on the climate change bill. Only 36 members crossed party lines on Affordable Care, and only 52 crossed party lines on climate change. I include Affordable Care in the model because that vote got a lot more attention, and there’s good reason to think that responses to the debate over healthcare reform would have a significant impact on voting behavior. It also helps us separate the effects of party-line voting from the effects of actually voting for the climate bill.
Adding the Affordable Care vote only boosted the model’s predictive power to 92 percent, but it is strongly statistically significant. Adding the climate change vote on top of that has no further effect (slightly negative, actually) on predictive power, and the effect of voting for the bill is not statistically different from zero.
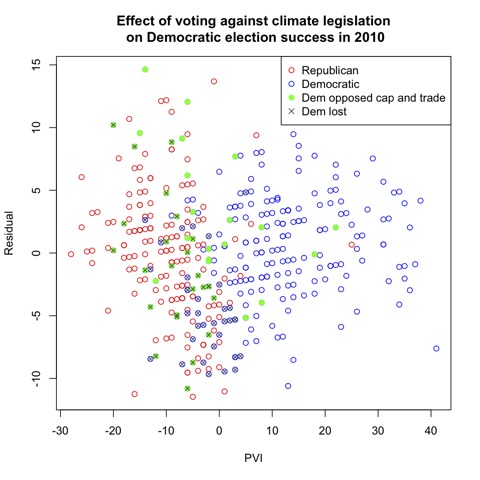
The figure above shows the residuals for the model without the climate change vote. Residuals show the difference between observed data and the model, and help us see if there is any systematic trend in that un-modeled variation. The higher up you go on the graph, the better a candidate did relative to the model’s predictions, the lower they are on the graph, the worse they did relative to expectations. The green dots are Democrats who voted against the bill, and Democrats who lost their seats are marked with an x. If voting against the bill were necessary to save Democrats, we should see those green dots clustered toward the top of the graph, but they are distributed fairly evenly.
There’s no evidence that voting for or against the climate bill did Democrats any harm at the polls.

