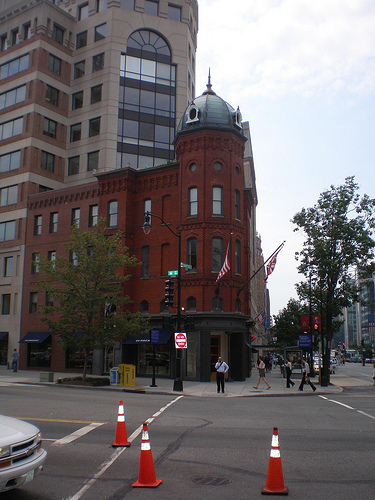
 On this street in Washington, D.C., old and new stand harmoniously side by side.Photo: Dave ReidA great neighborhood improves over time, like a stew simmering in its spices. New homes or businesses fill in the odd left-over spaces or selectively replace those that have reached the end of their lifespan. The existing homes are added to, tweaked, redesigned, taken away from, and variously molded by the individual personalities of the people living in them. Trees mature, shrubs fill out. The neighborhood achieves a quality we can’t quite put our finger on. So we call it character, almost as if it belongs to a living person. It’s simply impossible to replicate this with a development built from whole cloth.
Jane Jacobs celebrated mixing the old and the new together, so much so that she considered it one of only four principles of good urban form. If a neighborhood is all old buildings, it’s either a staid museum piece for tourists or a victim of severe economic disinvestment. If a neighborhood is all new buildings, something else is lost. Families with less money are priced out by the costs of new construction, and so are the innovative new ventures that cities thrive on. As Jacobs puts it, “Old ideas can sometimes use new buildings. New ideas must use old buildings.” She believed that, as long as zoning laws are flexible or at least generously enforced, any urban neighborhood could naturally evolve into a vibrant, historically diverse district.
Can this kind of historical “character” be measured somehow? Today we have tools like Walk Score that measure the concentration of different amenities around a home. Prospective buyers or renters can use it to help them decide whether the home fits their lifestyle or not. And the online tool Abogo gives us some idea of how much transportation might cost while living at a given location. Wouldn’t it be cool if we could do the same thing for the historic diversity of the area around the home?
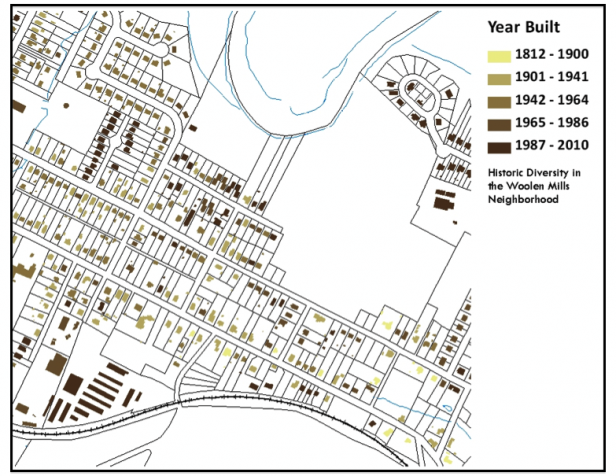 I decided to use my own home in Charlottesville, Va., as an experiment. First, I dug up the year that each building in my neighborhood was built, using the city’s tax assessment records, which should be publically available in your own community as well. The numbers gave me the map above.
Then I drew a circle with a quarter-mile radius around my house — basically encompassing anything I can walk to — and looked at all of the buildings that fell within it. There are 423 of them, and the chart below shows when they were built.
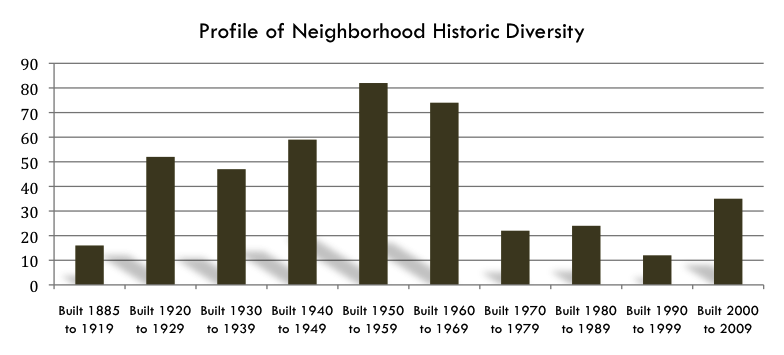 We see a nice balance of older working-class bungalows, lots of standard ranches, and even a smattering of funky new modernist homes here and there. There’s a quiet period between the ’60s and the ’90s, when builders bypassed our neighborhood for the greener pastures beyond. But in the last decade, newer infill homes have broadened the range of styles and quality available. This wide range of housing ages translates to a wide range of prices, which means a diverse cross-section of people living together. Of course, a lot of these features are what drew us to live here in the first place.
To come up with a meaningful way to compare different neighborhoods, we’d need a score for this kind of historic diversity. The easiest way to do this is to just take the standard deviation of the years each structure was built. For the area encircling our home, this comes out to 24.7. That’s our score. I see no reason why this couldn’t be plugged into a database and computed for every home in the United States. Then I’d have some frame of reference for what my number actually means.
Sure, it’s not the same as walking around the block and observing how the pieces of the built environment have grown up together over time, but it would put an objective stamp on an area that might help us explore all sorts of interesting correlations. Do historically diverse neighborhoods have more resilient property values? Are they more walkable? Are they also economically or racially diverse? Jane Jacobs thought so (and so do I), but it would be nice to be able to show it with numbers.


