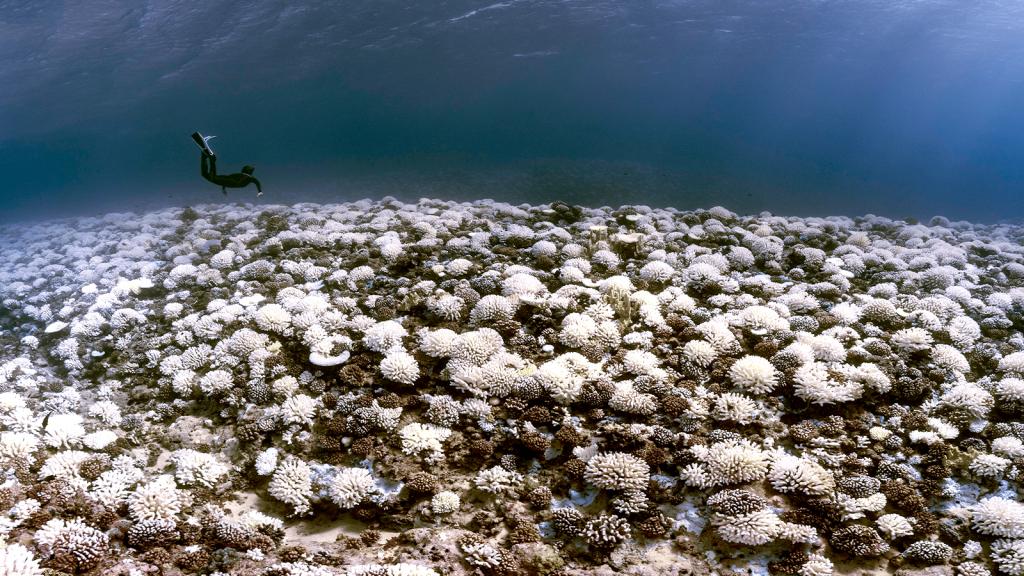
The Climate Hot Map, from the Union of Concerned Scientists, notes climate trouble spots worldwide. These are by no means all the effects of global warming — for instance, we're guessing that Canada is not in fact a charmed oasis, untouched by climate change outside of one river in the Northwest Territories. But it does give you a sense of just how widespread the crisis is. (And maybe they'll keep updating it until it's just a mass of flags.)
That's all well and good, but what if you're trying to decide whether to invest in a snow shovel or a sump pump, so you want to know how climate change is going to play out in your personal backyard? If you live in California, you're in luck. The California government has put together Cal-Adapt, which lets you visualize various climate change impacts (temperature, snow pack, water level) as they've changed since 1950, and as they're projected to keep changing over time.


