From Gordon Price’s most recent Price Tags newsletter — a computer simulation of traffic congestion that will run on any java-enabled web browser.
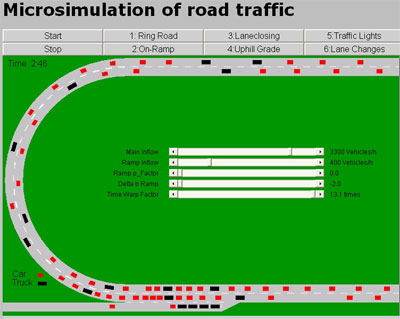
It’s mesmerizing to watch “phantom” traffic jams form — temporary slowdowns in traffic caused just by congestion, without any obstacle in the road.
And the especially nifty thing (or big time-waster) for me is that you can tweak the settings — traffic volume, driver politeness, road setup — to see what kinds of things lead to more congestion. For example, traffic that flows along smoothly when the speed limit is set at 80 km per hour (about 50 miles per hour) might completely jam up when the speed limit is bumped to 100 kph (or 60 miles per hour). And the same road can jam up when speed limits are decreased to 40 km per hour. This may seem either counterintuitive or completely obvious, depending on your perspective. In both cases, though, it’s pretty easy to identify with the little dots stuck in traffic — the congestion patterns are all too familiar.
As drivers, we tend to think that we exercise conscious control over what happens on the road– which makes it easy to blame other drivers’ “mistakes” when traffic slows down for no apparent reason, as in a “phantom” traffic jam. So it’s instructive to see that little computer rectangles following simple rules show the exact same kinds of complex traffic patterns that humans create. Which is a reminder, perhaps, that the rules of the road can have more of an effect on real-world outcomes (traffic or otherwise) than our conscious choices — which really is something to chew on while you’re stuck in traffic.