This is a guest essay from Amory B. Lovins and Imran Sheikh of the Rocky Mountain Institute.
—–
David Bradish, in a post on the blog of the Nuclear Energy Institute, criticizes our methodology used to derive micropower’s output in “The Nuclear Illusion” (PDF). As Mr. Bradish notes in hypertext, our methodology is online here (PDF), and our micropower database is posted and documented here. Here’s our point-by-point response to his critique:
“With the exception of nuclear, the data for the chart aren’t actual generation numbers. RMI collected the capacity and capacity factor data for the other sources to calculate the generation.”
For many generation types, only capacity and capacity factor data are available. That’s partly because the data often come from surveys of production or installation, typically based on unit-by-unit data from vendors or their trade associations. Data on measured output are rarer because they’re normally collected by national energy authorities that often don’t count small and non-utility units or don’t consistently record the type of unit. Then those output data are added up, with many gaps, to estimate global totals.
We used all the reliable capacity data we could find using bottom-up industry data covering most main countries, though with notable gaps we described. Then we calculated output using capacity factors that Mr. Bradish agrees are reasonable (other than cogen — see below). Finally, where possible, we compared calculated output to estimated output from other sources to verify that our calculations were realistic. If more generation data were available, we’d be glad to learn about them so we can apply them to our analysis. But so far, measured global generation data are available only for nuclear, though some specific jurisdictions do track other sources too.
“The problem with the 83 percent [Non-Biomass Decentralized Co-Generation] capacity factor is it is twice as high as what it should be.”
The data we used from Michael Brown at WADE (which compiled the leading global cogeneration database on which we relied) suggested that Non-Biomass Decentralized Co-Generation capacity actually runs (not just is available to run — an ambiguity Mr. Bradish wrongly introduces) about 7,250 hours per year, or 83 percent of the time. (Mr. Brown’s estimate was actually a range — ~7,000-7,500 h/y, “possibly more,” and we chose the mean). WADE’s economic analysis of cogen on p. 5 of the cited World Survey of Decentralized Energy 2005 uses 7,500 h/y, equivalent to 85.6 percent.
Mr. Bradish’s incorrect claim that our 83 percent cogen capacity factor is two-fold too high results from combining three errors:
- Average capacity factor of all decentralized plant types cannot be validly applied to cogeneration or any other type in the mix: Mr. Bradish calculates the average capacity factor of several kinds of decentralized electricity sources (for a subset of countries, see next point) and applies it to cogen. However, decentralized electricity comes from many sources (wind, PV, solar-thermal-electric, geothermal, biomass/wastes, small hydro, other renewables, cogen) with widely varying capacities and capacity factors. Some decentralized generators, like wind and PVs, have much lower capacity factors (nominally 25 percent and 17 percent respectively) than the overall average (66 percent), while other components like biomass, geothermal, and decentralized cogen have higher capacity factors than the average (70 percent, 75 percent, and 83 percent respectively). Clearly it’s wrong to apply the average of all sources to a single type — whether cogen or, say, photovoltaics, which under Mr. Bradish’s logic would also have a capacity factor of 40.1 percent.
His claims that “it is impossible” for cogen to have an 83 percent capacity factor, since it makes up “the majority of the decentralized capacity,” overlooks that our micropower data include many types of renewables that WADE excludes. For example, windpower, with >100 GW installed worldwide, is the largest single component of renewables-other-than-big-hydro, but WADE excludes 95 percent of windpower and assigns an 18 percent capacity factor to the 5 percent (small onsite unit) that it counts. We count 100 percent at 25 percent average capacity factor.
Our methodology derives our stated average capacity factor from the empirical capacity factors for each source. Our nominal 83 percent cogen capacity factor is entirely consistent with the ~80-90+ percent often observed in the process industries that adopt cogen, combined with the lower but still substantial capacity factors of district heating systems in the cold climates where they’re used. An average 40 percent capacity factor for total cogeneration would be very low, and would often make the investment unattractive.
- Small sample of countries may not represent the whole: The WADE 2005 Survey includes generation and capacity factor data for 14 countries. Bradish assumes that the overall capacity factor for these 14 countries (40.1 percent) will apply to the whole world. But the mix and operating conditions of decentralized plants in these countries may not be representative of the global mix.
Decentralized generation provided 971.5 TWh (2003-04 data) in the 14 countries WADE profiled for 2005, but that excludes the rest of the world, 95 percent of windpower, and 100 percent of other renewables except photovoltaics. RMI’s definition of micropower includes all renewables except big hydro (<10 MW), so RMI's worldwide estimate of 2,473 TWh (2004) for all decentralized generation seems reasonable under these circumstances. RMI’s estimates for distributed renewables are also very close to the independent bottom-up compilation at ren21.net; that authoritative source’s estimates are slightly higher than ours because it uses a higher size cutoff for small hydro.
- Potential confusion over peaking and standby plants: It’s unclear in the WADE report whether national profiles include standby and peaking plants as part of decentralized capacity. RMI’s analysis explicitly breaks out standby and peaking plants according to WADE’s global estimates, and excludes those plants from our capacity and output totals unless otherwise specified. Mr. Bradish’s estimate that cogeneration/decentralized fueled generation has a 40.1 percent capacity factor is probably distorted by including a large amount of standby and peaking capacity that rarely runs: WADE’s 2006 survey, on p. 34, shows nominal capacity factors of 72.5 percent for continuously operating engine and gas-turbine units, 12.5 percent for peakers, and 2.5 percent for standby units.
Together, these three errors account for Mr. Bradish’s two-fold underestimate of cogen capacity factor.
“There is [no] … methodology” for RMI’s projections of micropower growth during 2008-2010.
Our methodology is clearly described. For cogeneration, which seems to be the part Mr. Bradish takes exception to, we started with the 2005 projections for 2012 by WADE, the World Alliance for Decentralized Energy — the global umbrella trade organization for distributed generation. We conservatively decreased WADE’s growth target from 14 percent to 12 percent, consistent with WADE’s director’s recommendation, to take account of current market developments (such as gas prices). However, our graphed projection to 2010 is not, as Mr. Bradish implies, relevant to our demonstration that micropower already surpassed nuclear’s global output in 2006 and its capacity in 2002.
“RMI’s graph is all ‘chartjunk.’ The graph displays a lot of ink for the ‘Total renewables plus decentralized generation’ data that deceives the eye.”
Mr. Bradish argues that our Figures 6 and 7 (“The Nuclear Illusion” p. 30) deceive the reader by giving more weight to micropower than to nuclear. He offers a modified figure in which each type of micropower is represented as a separate unstacked line:
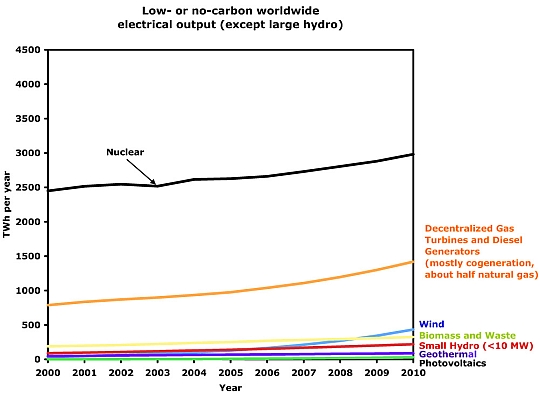
This misses the point of our graph: that the diversified portfolio of micropower technologies exceeds nuclear’s capacity and output in total, though not in each component, and is growing far faster in aggregate. Mr. Bradish unstacks the graph to fragment micropower, obscure its total effect, and thus make nuclear look good. Since it’s hard for readers to do the mental addition of many separate types of micropower and translate their sum into a mental picture, we stacked our graph, so readers could see how many small units of many types add up to more capacity and generate more electricity than nuclear. That’s not incorrect; it’s just awkward. Mr. Bradish should deal with this reality, not claim it’s somehow an artifact of an incorrect graphical representation.
We are familiar with Prof. Tufte’s excellent books on honest and effective graphics, and we take his lessons seriously. One of them is to design the graph to tell the story intended. Our story is that nuclear has been surpassed and far outpaced by a swarm of diverse micropower technologies, even though it’s bigger than any of them individually. So long as the nuclear industry fails to grasp this, it will continue to misunderstand what its most potent competitors are. Gulliver was bigger than the individual Lilliputians, too, but together they laid him low.
Prof. Tufte coined the pejorative term “chartjunk” to refer to ink that conveys no news. Mr. Bradish misapplies it to a clean and clear graph conveying news he finds unwelcome. That’s blogjunk.
“Cherry-Picking the Data”
Mr. Bradish’s accusation that RMI selected anomalous data to support our argument overlooks several key points besides his mistaken redrawing of our graphs. He objects that WADE’s 2005 Survey, by correctly describing a slowdown in cogen growth around 2003, is somehow inconsistent with RMI’s data. Quite the contrary: our analysis clearly reflects that slowdown, as well as the very rapid growth we documented in and after 2005 in distributed renewables (see Fig. 8, p. 35, in “The Nuclear Illusion”). Moreover, the cogen market has since revived, adding more capacity in 2006 than in any year since 2000, the first year of the Diesel and Gas Turbine Worldwide (DGTW) survey. Mr. Bradish has somehow overlooked this finding of WADE’s 2006 survey, which he cited above for other purposes (a practice he calls “cherry-picking the data” when he wrongly accuses us of doing it).
Our database accurately shows the year-by-year fluctuations in each technology: for example, nuclear net capacity additions in 2003 were the lowest of any year from 2000 to 2006. WADE’s 2006 survey notes (p. 36) that thanks to recent growth, distributed generation’s share (using its narrower definition) of total world power generation nearly doubled in four years, from ~13.0 percent in 2002 to ~24.5 percent in 2005. Nuclear power’s share remains stuck at about 2 percent.
“Is Coal Included in the ‘Non-Biomass Decentralized Co-Generation’ Data?”
Yes, but not much. Our “Non-Biomass Decentralized Co-Generation” data are based on 2004 data in the WADE 2005 Survey. Capacity in subsequent years is calculated by adding the new installations reported in DGTW. Although coal is not included in those yearly additions reported by DGTW, the 2004 fuel mix is unknown. It does include some coal, chiefly in China and India (where gas is often unavailable), and to some extent in Germany, all aided by coal subsidies. The U.S. Energy Information Administration’s partial cogen database also reports that in 2006, 18.7 percent of the electricity produced by the U.S. industrial and commercial sectors from fossil fuels, or 13.7 percent from all sources, was coal-fired, some of which was culm or waste coal (Annual Energy Review 2006, p. 229). However, even coal-fired cogen greatly reduces the carbon otherwise emitted by separate production of power and heat, because it displaces the separate fueled boiler(s) otherwise needed to produce the heat that cogen recovers. The resulting carbon saving is smaller than for the predominant gas-fired cogen, let alone for renewables, but is still substantial.
Summary: … RMI’s analysis erroneously uses twice the actual capacity factor for ‘non-biomass decentralized co-generation. Second, RMI’s analysis distorts the actual contribution from nuclear’s ‘true competitors’ with the use of chartjunk. Third, RMI’s analysis makes selective use of data in order to state that nuclear’s ‘true competitors’ are turning ‘in a stunning global market performance’ when in fact one [of] their own sources actually says the opposite. Finally, RMI’s analysis misleads the reader by not stating that coal is included in this graph, when actually it is.
Our responses above show point-by-point that:
- Our 83 percent cogeneration capacity factor is correct, plausible, and possibly conservative.
- Our graphs correctly show the total effect of nuclear’s non-central-plant competitors; Mr. Bradish prefers to omit the embarrassing total.
- Mr. Bradish shows no defect or selectivity in our data about competitors’ market performance, says nothing about the renewable competitors whose performance was the most “stunning” (as we called it), and selectively mischaracterizes what our primary data source said about cogeneration. When, as occurred in 2006, nuclear adds 30-40x less capacity than micropower, a tenth as much as wind, and less than even photovoltaics, that is indeed stunning.
- We correctly described onsite generators not fueled by biomass or other renewables; Mr. Bradish criticizes us for not itemizing their fuel portfolio, even though fuel-mix data range from sketchy (roughly half gas on the margin) to nonexistent, and readers may be safely presumed to know what fossil fuels comprise.
RMI’s analysis is not perfect, but we have made a conscientious, transparent, and well-documented effort to assemble the best data available. Suggestions for improving our analysis will be gratefully received at isheikh [at] rmi.org.