A few moderate senators in both parties hold in their hands the fate of climate legislation — and hence the possibility that the nation and the world might have a realistic chance of averting catastrophic climate impacts. That’s because
- The GOP has made the fateful — and fatal — decision to cast its lot with dirty energy and anti-scientific denial (see “Hill conservatives reject all 3 climate strategies and embrace Rush Limbaugh“).
- The overwhelming majority of Democrats are, like Tom Perriello (D-VA), willing to do the right thing even if it has little or no short-term political benefit and possibly a real political cost for them (see Perriello: “The Republicans may win some seats because of this vote, but they can’t regain their souls for demagoguing the issue.”)
Readers have asked for a discussion of the key swing senators. I will begin a multipart series on that by examining a fascinating statistical analysis of who “Who Voted for the Climate Bill [in the House]? (And Why?)” by the stat master Nate Silver of fivethirtyeight.com. Silver “built a logistic regression model that attempted to predict the likelihood of a particular congressman voting for the cap-and-trade bill as the result of a variety of factors.”
Ultimately, he found a “pretty useful” set of variables that “explains about three-quarters (R-squared = .74) of a particular Congressman’s vote on the climate bill. The model predicted 401 of 431 votes correctly.” Here are the factors affecting votes “listed roughly in declining order of significance”:
Ideology. The overall liberal-conservative bent of a Representative, as determined by DW-NOMINATE scores, which run from -1 for very liberal to +1 for very conservative. In this instance, I use the “common space” version of DW-NOMINATE scores, which are slightly less robust overall but place Representatives and Senators on a level playing field, which will come in handy later when we try and predict (as we will in a subsequent post) how the Senate will vote on the bill. Scores are as of the 110th Congress; for freshman Congressmen, they are extrapolated from Progressive Punch scores.
District Partisan Lean. The PVI (Partisan Voting Index) in a district was a highly significant variable; Congressmen in Democratic-leaning districts were more likely to vote for Waxman-Market and those in Republican ones more likely to vote against it, all else being equal.
Lobbying Money. As in the case of health care, funds raised from certain types of PACs are a significant predictor of a representative’s vote, although the money in this case cuts both ways. Whereas receiving contributions from coal industry PACs decreased the likelihood of a vote for Waxman-Markey, contributions from nuclear and alternative energy providers significantly increased it. I also looked at contributions from oil and gas industry PACs, public utility PACs, and agribusiness PACs, but these had no statistically significant effects. All data is taken from the Center for Responsive Politics and covers the 2004 cycle forward; contributions are divided by the number of cycles a Representative has participated in as a Congressman or as a candidate.
Carbon Emissions. I use county-by-county data on the amount of carbon emissions per capita in a particular area, as determined by Project Vulcan. This requires us to map the county data onto congressional districts by dividing the population of a county evenly among all congressional districts that occupy a part of its geography. Estimates are in metric tons of carbon consumed annually per capita. The carbony-ist district is the At-Large one in Wyoming, which produces 36.3 metric tons of carbon per capita; the least carbon-intensive are the 10th and 11th Congressional Districts of New York, which are both located in Brooklyn and are responsible for 1.1 metric tons of carbon per capita.
Poverty Rate. Although the Waxman-Markey bill contains provisions to refund a portion of increased energy costs to lower-income consumers, it was nevertheless more likely to receive support in districts where the poverty rate is low. Alternate measures of economic welfare like per-capita income work almost as well in the model and could serve as reasonable substitutes for the poverty rate.
Employment in Carbon-Intensive Industries. Lastly, the fraction of a district’s jobs that are in manufacturing, mining or agriculture was a good predictor of voting on Waxman-Markey (although this variable was significant only at the 90 percent level and not at the 95 percent level).
Yes, Silver is a smart guy with a lot of time on his hands! Further evidence of that fact is that he is in Vegas for the World Series of Poker — and yes, I am jealous! But I digress.
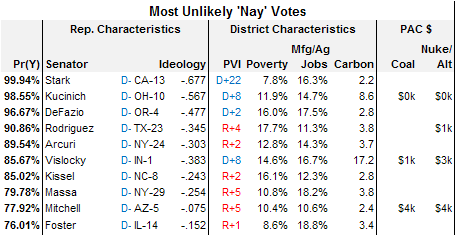
Perhaps the most interesting part of this analysis is the Members “the model thinks were most likely to vote for Waxman-Markey but in fact didn’t,” the Members with a high Probability of a Yes Vote – Pr(Y) – who voted “nay”:
Silver notes:
The first three names on this list – Pete Stark, Dennis Kucinch, and Peter DeFazio, apparently all cast nay votes on the bill because they they thought it was too conservative. One imagines that they might have voted for the bill nevertheless if their votes were necessary to secure passage – but as it actually went down, they didn’t.
I am not a big fan of these “no” voters. This was not the time for symbolic protest votes. It was the time for running up a sizable victory to send a message to the Senate. Indeed, I’m sure that Pelosi and the House whips let a number of vulnerable members vote no because they weren’t needed. While understandable tactically, I think that was strategically unwise.
You can also check out Silver’s list of those who voted yes, even though their Pr(Y) were well below 50% – McHugh (R-NY), Hill (D-IN), Space (D-OH), Teague (D-NM), Reichert (R-WA), Lance (R-NJ), Peterson (D-MN!), Castle (R-DE), Skelton (D-MO), and Bono Mack (R-CA). Some people, especially moderate Republicans, are willing to break with their ideologically rigid party leadership and do the right thing. Big kudos to all these Members.
Silver’s “general takeaways”:
- People on the whole were pretty rational in trying to balance “selfish” traits (their own ideology; lobbying influences) against “unselfish” ones (the economic and political characteristics of their districts).
- Nevertheless, the playing field is fairly broad, as there are quite a few representatives for whom these traits balance out in ambiguous ways. Some 95 representatives — about 20 percent of the House — were deemed to have between a 10 percent and a 90 percent chance of voting for the bill and can reasonably be described as swing votes.
- Cap-and-trade differs from health care in that there are particular private sector groups that would appear to benefit from its passage: nuclear power and renewable energy providers. Although the nuclear energy lobby is small, and the alternative energy industry lobby is very small, they nevertheless appear to have had some influence; nuclear is a big, untold part of this story. On the other hand, the effects of the agricultural lobby appear to have been mostly neutralized, perhaps because of concessions made in the bill to farm-state Democrats.
- This bill faces long, but not impossible, odds in the Senate.
I’m not certain how “nuclear is a big, untold part of this story,” since the bill doesn’t have any direct goodies for the industry, although obviously any carbon price helps low carbon energy sources. I do expect that nuclear will be a big, well-told part of the story in the Senate.
I’m not certain the bill faces “long” odds in the Senate. I’d put it at better than 50-50, actually — it is entirely in the hands of President Obama, I think. But it won’t be the same bill.
Silver has applied his analysis to the Senate side, which I will discuss in part 2.