You may have heard that Americans are pumping less carbon dioxide into the atmosphere than we were a few years ago, which is great for mitigating climate change. But as Ben Adler pointed out in a post for Grist on Sunday, we still have a long way to go. CO2 isn’t the only greenhouse gas, and its often-overlooked “co-pollutants” have more immediate, localized effects on human health, particularly for poor communities and people of color.
During an address to the Congressional Black Caucus Foundation last month, EPA chief Gina McCarthy pointed out that emissions of co-pollutants such as nitrous oxide, hydrofluorocarbons, sulfur oxide, and soot contribute to as many as one in 10 deaths in urban areas. “That is not acceptable,” she said.
“And we know that minorities are more likely to live near hazardous waste sites,” McCarthy added. “We know that respiratory and cardiac illnesses there are at a higher rate. For example, an African-American child is five times more likely than a white child to die from an asthma attack.”
It’s not news that large polluting factories are often concentrated in communities where people of color and of low-income are the primary, if not the exclusive inhabitants. But an EPA report released last week drives this point home. The report, which documents greenhouse gas emissions from large facilities in 2012, is accompanied by interactive maps showing where those facilities are located (at least the ones that actually report to the EPA).
Looking at those maps, I located five of the nation’s worst areas where waste processing plants, refineries, and power plants are bundled — much to the detriment of families living close by. (A factory icon represents a single large facility, while circled numbers indicate clusters of these facilities.)
5. New York City
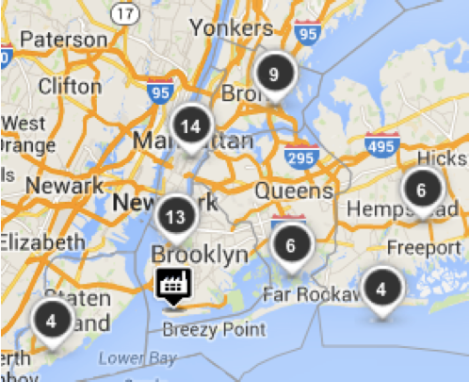
That factory icon in Brooklyn marks the Brooklyn Navy Yard Cogeneration Project, a power plant that was responsible for almost 870,000 metric tons of CO2 in 2012. That’s down from over 1.1 million emitted in 2011, but it still pumped out over 500 metric tons of nitrous oxide, a pollutant can cause reproductive problems for women exposed to it over an extended term. Nationally, nitrous oxide emissions increased 4 percent between 1990 and 2011.
4. Baton Rouge-New Orleans, La.
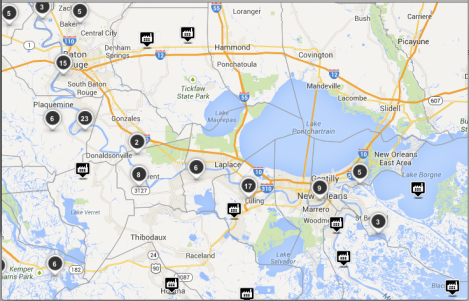
That stretch from Baton Rouge to New Orleans, with chemical processing plants marking the route, is known infamously as “Cancer Alley” by environmental justice advocates and fenceline communities that have suffered under the fog of pollution for decades. In one industrial area of Iberville Parish alone (right below South Baton Rouge on the map) there are 23 facilities.
3. Long Beach-Bakersfield, Calif.
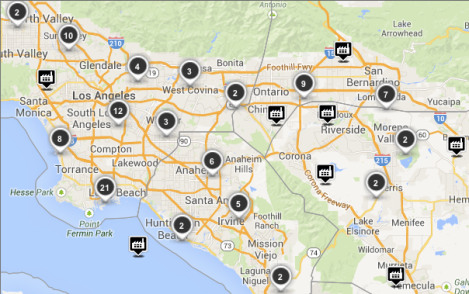
The Chevron Refinery in El Segundo (near the circled 8 along the coast) spewed almost 3.5 million metric tons of CO2 in 2012, almost the same amount it emitted in 2010. It also flares and spits sulfur oxides, or SOx — over 57,000 pounds this year alone — which are linked to asthma when one is exposed to it for as short as five minutes.
2. Ft. Worth-Dallas, Texas
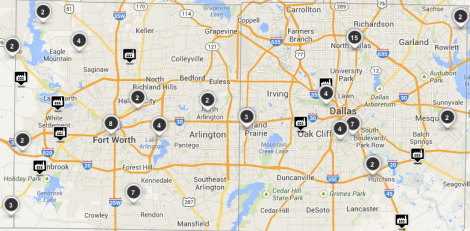
Just west of Dallas, near Oak Cliff, is the Mountain Creek Generating Station, which burns natural gas, the fuel credited for helping drop overall greenhouse gas emissions this year. Its CO2 emissions rose from about 415,000 metric tons in 2011 to close to 525,000 metric tons last year.
1. Houston-Galveston, Texas
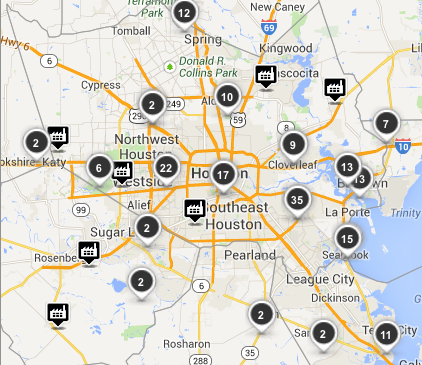
This picture says it all. From Houston to Galveston (in the lower right corner) to Port Arthur (just off the top right corner of the map), this is perhaps the most polluted, definitely the most clustered area in the nation. The Port Arthur area is where the Keystone XL pipeline would end, bringing tons of dirty tar sands and refinery waste to an already beleaguered community.