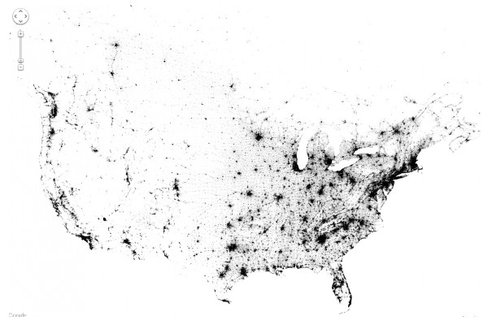

Brandon Martin-Anderson Public DomainGrandma? Is that YOU? (Click for the zoomable version.)
Have you ever wanted to see a map of the United States and Canada that shows every single person living there? Probably not, but Brandon Martin-Anderson, a young man with a jaunty cap who works with the MIT Media Lab, wanted to. So he created a map with no borders, no geological features, no cities — just 341,817,095 dots, one for each man, woman, and child living in the U.S. and Canada.
Of course, in metropolitan areas these dots kind of blur together into a smudge. If you live in Trout Creek, Mont. (population 280), and zoom in, you might be able to see yourself. If you live in Boston, or pretty much anywhere on the East Coast, however, you will not. But assuming you aren’t one of those crazy people who refuses to turn in your Census form because you think it violates the Fourth Amendment, rest assured there is a dot for you. (The map is based on Census data — if you want to know more about its construction, check out the technical details here.)
Looking over this map, a few thoughts spring to mind. One of them is, “Wow, the East is extremely crowded, and so is L.A.” The next (related) thought is, “Oh, that’s why we have the electoral college.” It is also neat to see how the major roads show lines of population along them, although of course this is not really surprising. People do love their thoroughfares.
Wondering why Martin-Anderson thought it would be a worthwhile project to put 341,817,095 dots (the number represents the most recent Census records of both countries) on a map? He says: “I wanted an image of human settlement patterns unmediated by proxies like city boundaries, arterial roads, state lines, &c. Also, it was an interesting challenge.” Definitely. We think his dot deserves its own tiny gold star.