To kick the series off, let’s take a broad look at the power industry.
(The charts below are taken from a fantastic June 2010 report by Ceres: “Benchmarking Air Emissions.”)
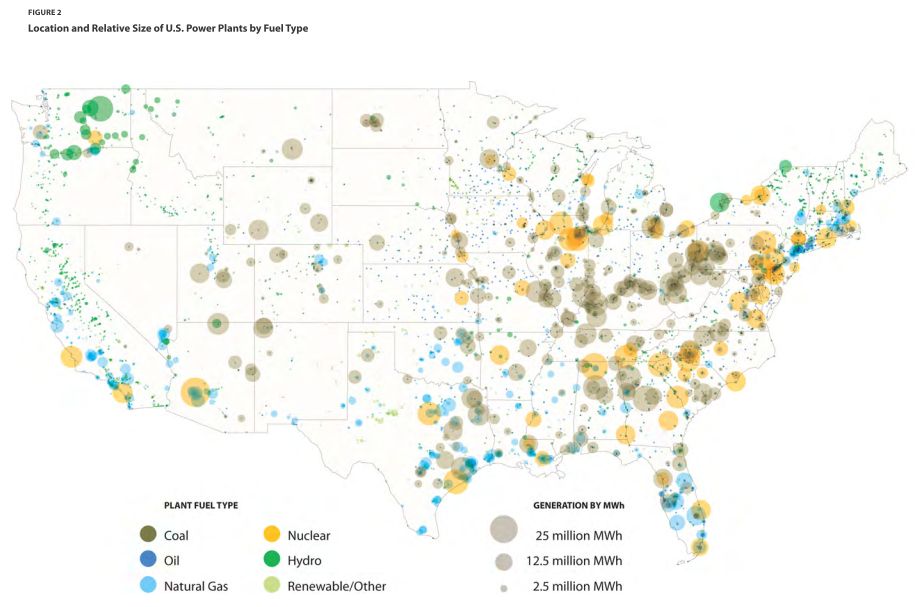
Here’s where the top 100 biggest power plants are (click for larger version):
 Ceres: “Benchmarking Air Emissions“
As you can see, the West Coast and the Northeast have a reasonably diverse (and low-coal) mix of power generation. In the Midwest and South, it’s mostly coal and nuclear. And there you have climate politics in a nutshell.
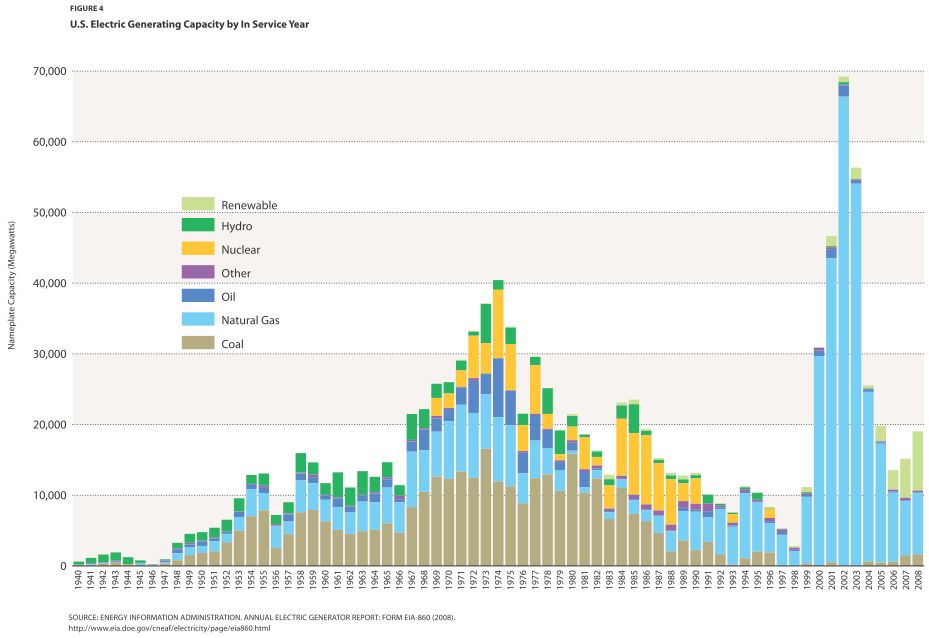
Now, that’s where the power plants are, but even more interesting is the when. Here’s a chart that shows how much and what kind of power generation has been built since 1940:
 Ceres: “Benchmarking Air Emissions“
We’d need someone more expert than myself (Sean?) to explain what drove these trends, but the trends themselves are clear enough. In the 1970s, there was a huge buildout — mostly coal, but also a good bit of natural gas, nuclear, and hydro. Notably, in the ’90s, new coal-plant construction tapered off almost completely and has never come back. This is worth emphasizing: For the past 20 years, nobody’s been building coal plants. They are not economically competitive, mainly because of the high capital expense of modern pollution controls. (Remember, coal can be cheap or clean, but not both.)
Obviously, in the early 2000s, there was a huge rush to natural gas, thanks to historically low prices. That rush is well past its peak now. Though new natural gas is still outpacing new coal, renewables are sneaking up. (For the first time in 2008, and again in 2009, investment in renewables outpaced investment in fossil fuels in the U.S. According to the U.N. Environment Program, the same will likely be true on a global basis in 2010.)
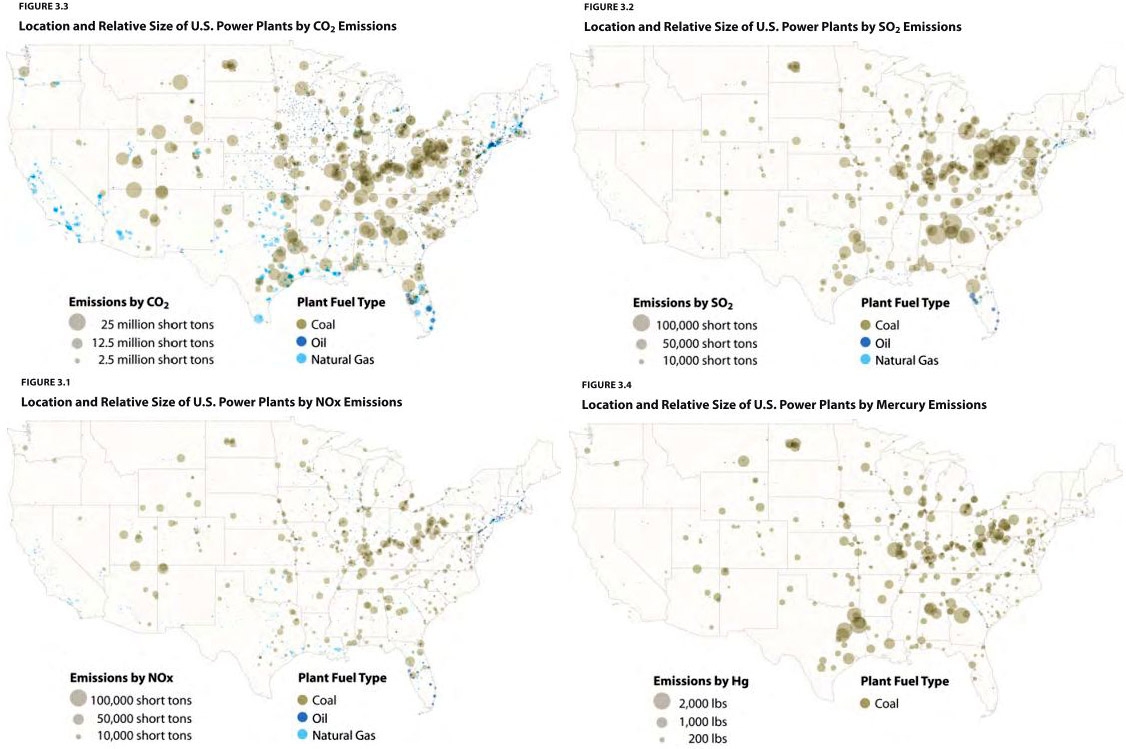
Now let’s have a look at those same power plants in terms of pollution (click for bigger version):
 Ceres: “Benchmarking Air Emissions“
These maps are broadly similar and they all tell the same story: Coal is dirty. It is responsible for the vast bulk of the power sector’s air and climate pollution.
Add the where, the when, and the how-much together and you get a pretty clear picture of the overall situation. There’s a lot of coal power out there — something like 45 percent of total power generation — but it’s mostly old. Lots of coal plants are nearing (or are past) the end of their planned useful life. The same is true for nuclear power plants. That same set of coal and nuclear power plants has been run more and more in the past 30 years, but they are reaching the limits of their capacity. They can’t run any harder and soon utilities will have to start retiring them or retrofitting them to modern standards.
Why are there so many old, dilapidated coal plants? That’s the question we’ll address in the next post.