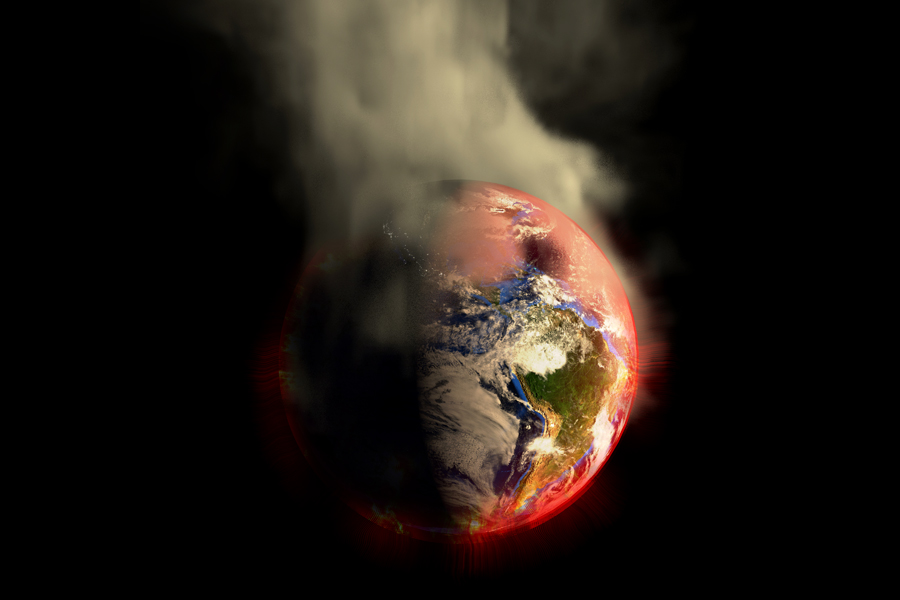
2012 was the eighth or ninth warmest year on record, depending on which data set you look at, according to the National Oceanic and Atmospheric Administration’s annual State of the Climate report, released Tuesday. That is just one of many extreme statistics identified in the survey, which pulls together the most recent information from hundreds of researchers worldwide on everything from temperature to sea level to Arctic ice. Taken together, the report’s authors say, the data paint an unmistakable picture of a warming planet.
“In 2012, certainly not every variable we looked at broke a record,” Thomas Karl, the director of NOAA’s climate data center, said. “I think what we’ve learned is one has to take a broad look at the climate system.”
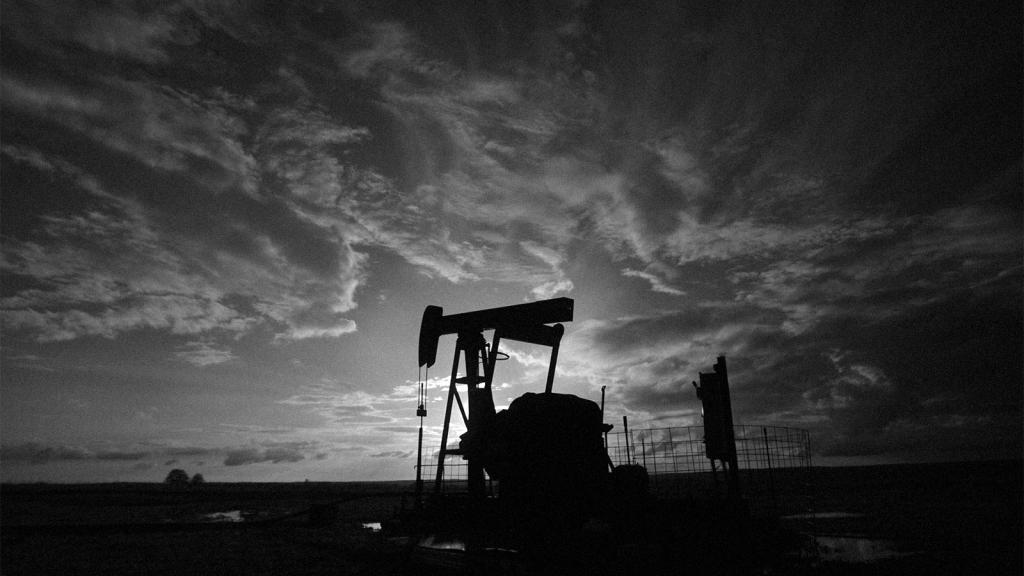
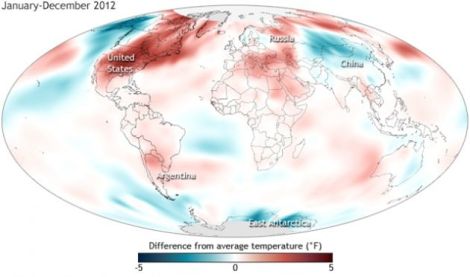
The heat map above, from the report, shows how 2012 temperatures compare to the average baseline of 1981-2010. While Alaska, parts of Asia, and elsewhere saw a cooler-than-average year, it was the hottest year on record in the contiguous United States (and, relatedly, an insanely expensive year for natural disasters), and temperatures in the Arctic are increasing twice as fast as the rest of the world. In June, Arctic sea ice minimums reached record lows, and over a two-day period in July more of the Greenland ice sheet was melting at once — 97 percent — than ever seen before.
NOAA’s National Climate Data Center
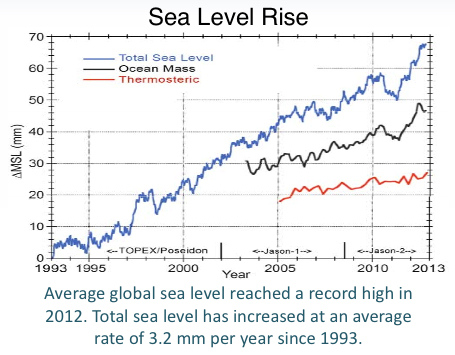
Another landmark was sea-level rise: 2012 saw the highest global sea levels ever recorded, the peak of a trend that has seen seas rising just above a tenth of an inch per year over the last two decades. Interestingly, in the last couple years, melting ice (the black line in the graph above) accounts for twice as much sea-level rise as does thermal expansion of warming water (red line). And the sea wasn’t just high, it was hot, too: Heat trapped in the top half-mile of the ocean remained near record highs. At the ocean surface, temperatures were among the 11 warmest on record, despite mostly flatlining since 2000 partly as a result of La Niña conditions that cool the sea.
Carbon emissions for the year were also their highest ever: In 2012, the world released roughly 9.7 quadrillion grams of carbon into the atmosphere, about one-tenth the weight of every living thing on Earth, pushing the atmospheric concentration higher, at least in some places, than at any time in human history. Other key greenhouse gases, including methane and nitrous oxide, also climbed from the previous year.
Sadly, all these shocking numbers weren’t much of a shocker to the report’s 384 authors from around the globe, NOAA’s Karl said; they merely offer the latest bundle of proof that climate change is happening: “We see ongoing trends continuing.”
 This story was produced as part of the Climate Desk collaboration.