Things are changing very quickly in the world of renewable energy. The conventional wisdom — that renewables are expensive, that they depend on subsidies, that it’s too costly to integrate them into the grid — is rapidly being rendered anachronistic, though no one seems to have told U.S. policymakers and pundits.
So let’s check in on the real cost of renewables. The International Renewable Energy Agency (IRENA), an intergovernmental research organization, recently released its latest report, “Renewable Power Generation Costs in 2014,” and it’s chock full of current info.
The news is mostly good. Let’s look at some charts!
—
But first, a quick note. To understand these charts you need to understand the “levelized cost of energy.” LCOE is often used as a kind of summary measure of the overall competitiveness of a particular technology or power plant. It includes capital and fuel costs, operating and maintenance costs, and financing costs, as well as the assumed rate of utilization. It does not include externalized costs, either positive (subsidies) or negative (health or environmental damages). It’s pure apples to apples.
IRENA maintains a comprehensive database of LCOE costs for power projects around the world and uses those as its basis of comparison.
Now, charts!
—
Here’s the LCOE for different kinds of utility-scale renewable energy projects, in 2010 and 2014:

The tan horizontal band across the chart is the range of LCOEs for fossil-fueled power. As you can see, biomass for power, geothermal, hydro, and onshore wind are now squarely in that range, or even lower. And solar PV, though it ranges widely in costs, is, on average, declining quickly — increasingly it’s also in the fossil-fuel range.
(It should be noted that all of these LCOE estimates exclude financial supports. This is straight-up, unsubsidized costs.)
Onshore wind, in fact, is now the most competitive form of electricity generation, not just among renewables, but period. Offshore wind and concentrated solar power (CSP) are still taking baby steps. As of 2014, their total global installed capacity is still comparatively tiny — 5 GW and 8 GW, respectively — but their costs are falling and should continue falling as the industries mature. And of course the rapidly falling cost of solar PV is the clean-energy story to beat all clean-energy stories!
—
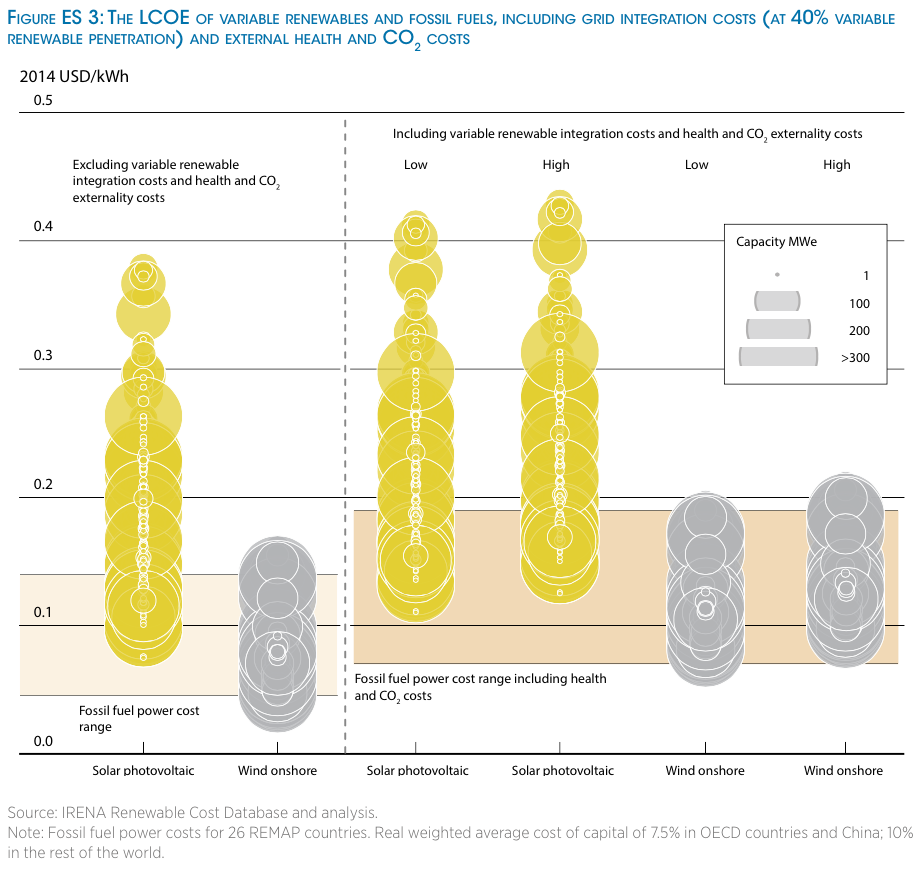
Here’s the same LCOE-based comparison, with a twist; in this next chart, IRENA added two key “external” costs. First it added the costs of integrating variable renewable energy into the grid (costs like spinning reserves, improving the grid, etc.), which turn out to be fairly modest, even modeled at 40 percent penetration. And it added the costs of fossil fuel’s health and environmental impacts, using a social cost of carbon ranging from $20 to $80 (which is too low).
The net effect of these changes is to make renewables considerably more competitive, mainly by raising the cost of fossil fuel power, as this before-and-after chart shows:
—
Speaking of onshore wind kicking ass, here’s a comparison of onshore wind (with external costs included) with other low-carbon options, including recent nuclear costs and projected costs from natural gas and coal with carbon capture and sequestration (CCS):
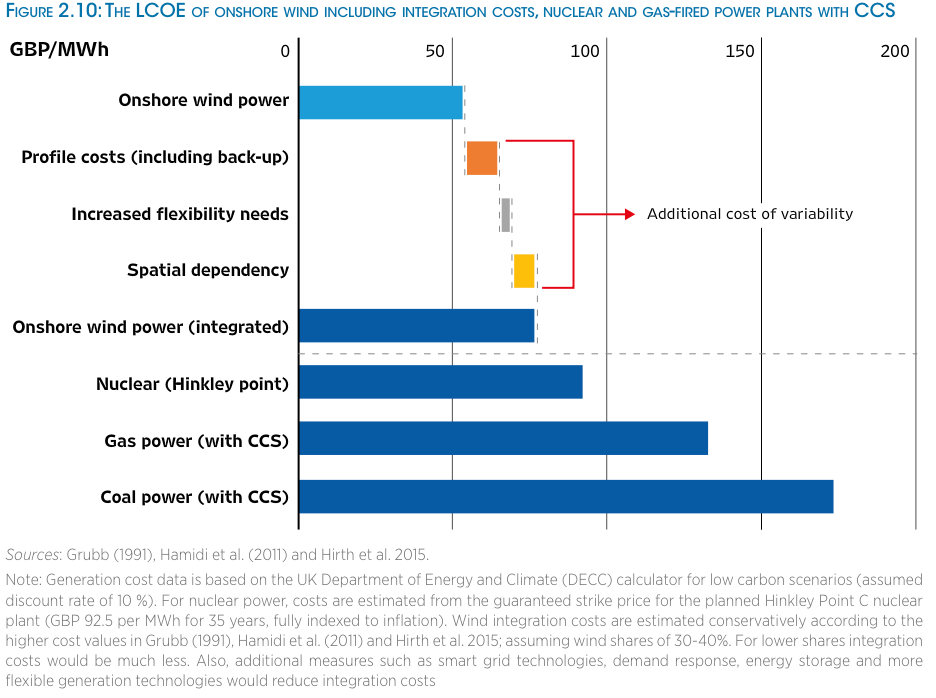
Like I’ve said so many times: Coal can be cheap and it can be clean, but it can’t be both at once.
Ponder: With wind growing and its costs falling, such that it’s already beating other low-carbon options even without subsidies, what will motivate global policy leaders to invest a bunch of money in CCS, which in addition to being more expensive involves complicated and untested new infrastructure? Why does everyone assume a bunch of CCS is going to come on the scene later in the century? The costs don’t support it.
—
Speaking of kicking ass, though the report focuses primarily on utility-scale power, it also includes this chart on the decline in costs for small-scale residential solar installations from 2008 to 2014:
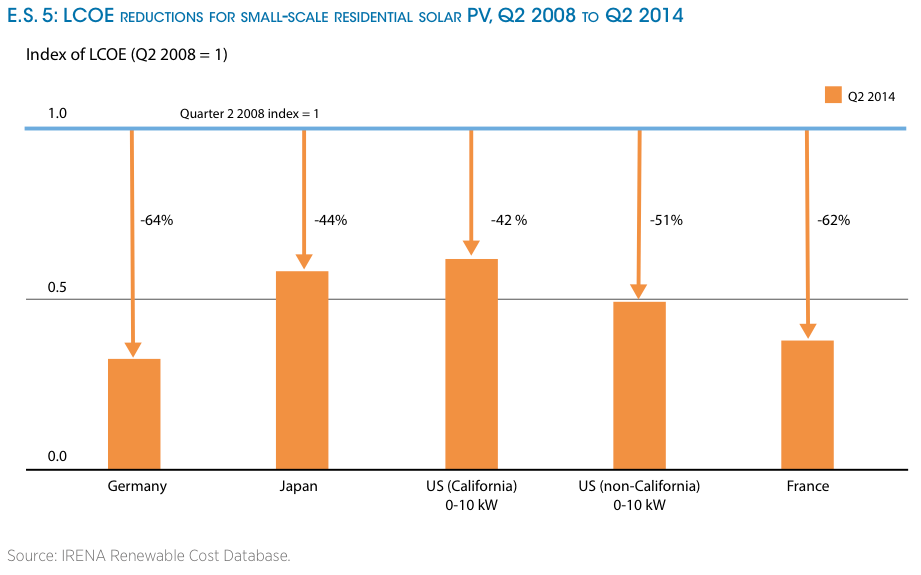
That is amazing. The massive 64 percent drop in Germany shows the power of learning-by-doing — non-panel “soft costs” are notoriously lower there than they are in the U.S.
—
This graph shows global renewable-energy capacity from 2000 to 2013:
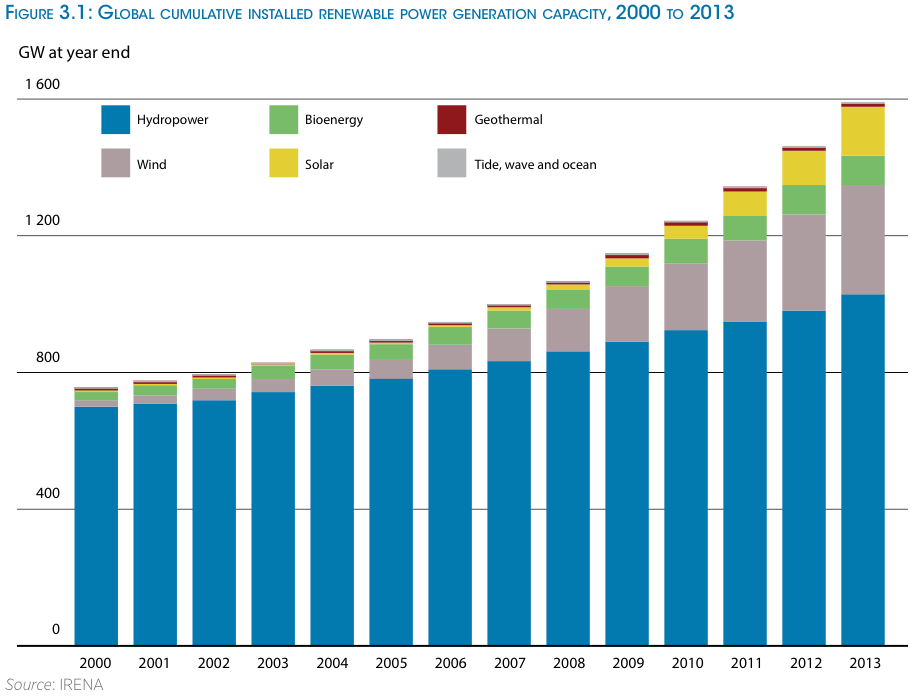
As you can see, hydro has long dominated the “renewables” category and still does, but other sources are beginning to scale up rapidly.
It will be a banner day when hydro no longer represents the bulk of total global renewable energy. I hope someone tells me when it happens so I can celebrate!
—
Finally, here’s what IRENA projects will happen to renewable energy costs between now and 2025:
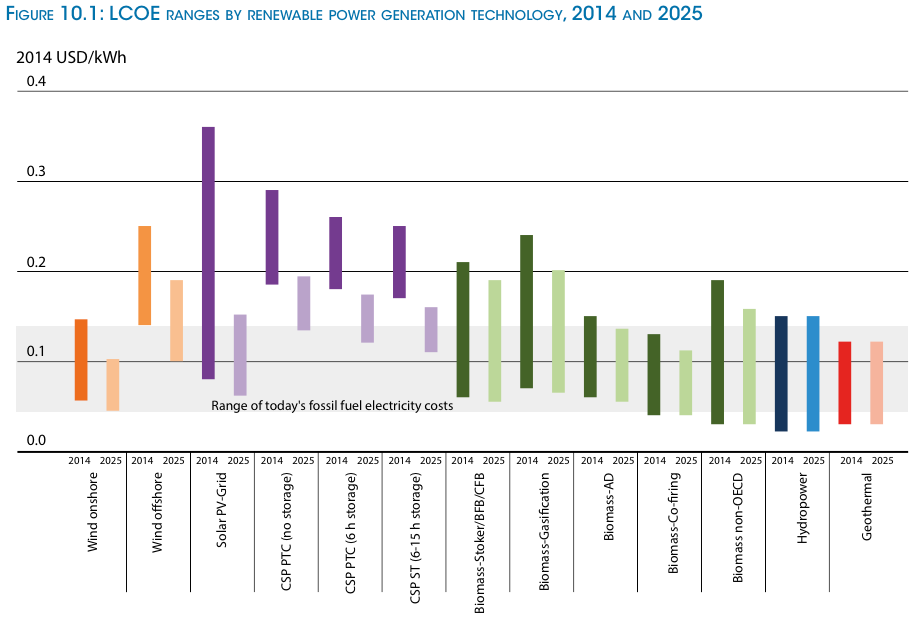
The technologies/industries over on the right, the “baseload” renewables, are fairly mature, so their costs are not expected to fall a huge amount. But wind and solar, in all their manifestations, are heading down, down, down. By 2025, people who want to build fossil-fueled power plants are going to have to justify themselves, not only environmentally, but economically.
—
The myth that renewables are “too expensive” has outlived its accuracy. A range of renewables are now competitive with fossil fuel power, without subsidies, and are only going to strengthen their position in coming years. It’s a new world out there.