The Clean Power Plan, officially unveiled by President Obama yesterday, aims to cut CO2 emissions from electric utilities 32 percent below 2005 levels by 2030. But underpinning the national goal are dozens of distinct state-level goals for reducing emission performance rates.
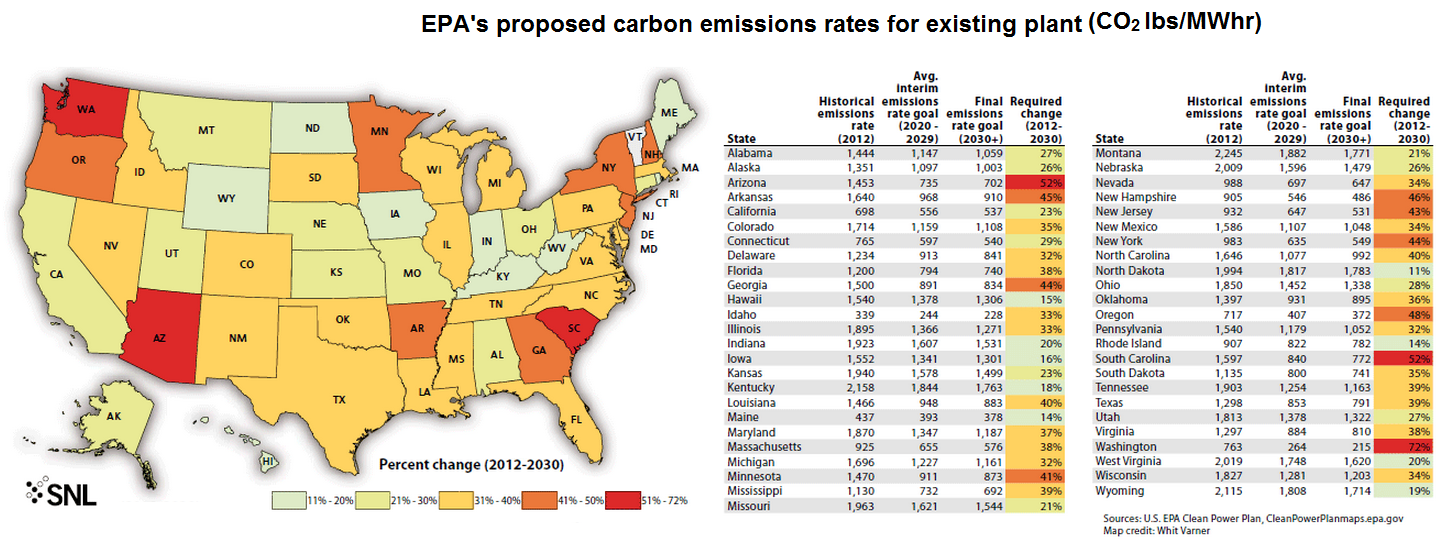
Why the variance in state goals? The goals were designed by the EPA to reflect unique electric sector conditions in each state: their current mix of natural gas versus coal and oil plants and their potential to cost-effectively incorporate more renewable energy — and to a certain extent, natural gas — into that mix. South Dakota is required to make the biggest emission rate cut: 48 percent below a 2012 baseline by 2030. (South Dakota shouldn’t have too much trouble meeting its goal, since the state has lots of wind potential.) Connecticut has the lowest goal; the EPA is calling for a cut of only 7 percent below its 2012 CO2 emission performance rate.
The state targets have changed from the ones released in the draft proposal in June of last year — some significantly so — because the EPA tweaked its formulas for calculating baseline emission levels and final goals. In the early version of the plan, states’ goals were widely divergent; now with the adjustments, the goals are more similar, falling into a narrower band of emission rates.
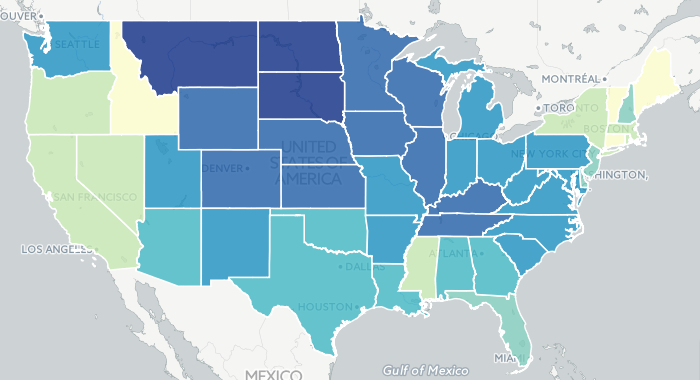
The map below shows the percentage reduction in emission rates that states are expected to reach by 2030, relative to 2012 levels. The EPA has not yet set targets for Alaska and Hawaii — it’s still figuring out how to deal with non-contiguous states — and it won’t be setting one at all for Vermont because the state doesn’t have any coal plants.
Click on a state for more information, including its historical rate, final target rate, and how the percentage reduction compares to the EPA’s earlier proposal.
[protected-iframe id=”187c0932e0bd560b156ce072d928f77a-5104299-90381964″ info=”https://caldern.cartodb.com/viz/259e560c-37b1-11e5-a791-0e4fddd5de28/embed_map” width=”100%” height=”600″ frameborder=”0″ webkitallowfullscreen=”” mozallowfullscreen=”” allowfullscreen=””]
Notes: The Clean Power Plan sets separate targets for lands of the Fort Mojave Tribe, the Navajo Nation, and the Uintah and Ouray Reservation; asterisks in the hover text indicate state targets that exclude emissions generated by power plants on tribal grounds.
Baseline and final rate goal data are from the plan’s state-specific fact sheets. If you’re interested in checking out the full text of the plan — in all 1,560 pages of glory — you can do so here.
This map illustrates states’ goals for cutting their CO2 emissions per megawatt-hour of electricity produced, relative to 2012 rates. To give states maximum flexibility, the EPA also set goals for each state to cut its absolute CO2 emissions (in tons) compared to a business-as-usual scenario, and states can decide whether to draw up plans to meet the rate-based goal or the mass-based goal. In some cases — like those of South Dakota and Connecticut, for instance — states’ overall CO2 emissions would actually be able to increase under the plan, relative to 2012 (but not relative to business-as-usual).

