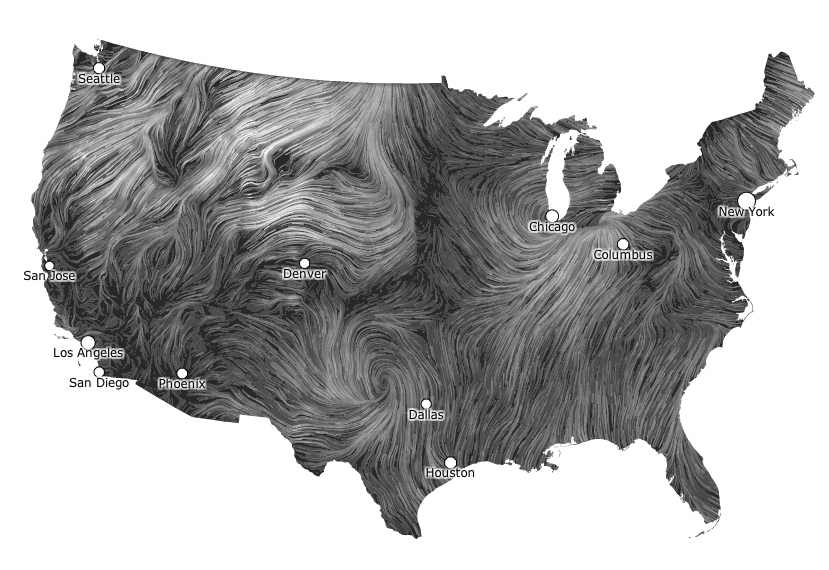

Data visualization wizards Fernanda Viégas and Martin Wattenberg have devised a real-time map of wind speeds in the U.S., and it beats the pants off spiky cold fronts, happy suns, and whatever else they’re putting on weather maps these days. It’s simple, elegant, and crazy hypnotic — watch it together with the lava lamp ocean currents, and you might just go into a turbulence-inspired trance and start making noises like Osborne Reynolds. (Look it up, jerks.)
Of course, this isn’t just for staring at while you listen to Orbital. It also demonstrates the massive potential of wind power. At any given time, you’ll see 30+ MPH winds across the Midwest — the image above, with its whorl of high winds around Montana, is actually from a pretty low-wind day, but here’s another one:

Maybe we can get Wattenberg and Viégas to code a version with subliminal images of turbines flashing in the high-wind-volume areas, and then use it to hypnotize Congress into embracing wind power.