We’ve gotten a lot better at mapping the oceans since the days of “Here There Be Monsters” — thanks, satellite overlords! — and now we have a new map to add to the stack: an up-to-date chart of exactly where the oceans have acidified the most.
A team of geochemists led by Taro Takahashi at Columbia University just published the research in the journal Marine Chemistry as a series of colorful maps (incidentally, our favorite form for groundbreaking scientific research to take). Takahashi and colleagues spent the past four decades collecting the data, which will serve as a benchmark for future measures of acidification.
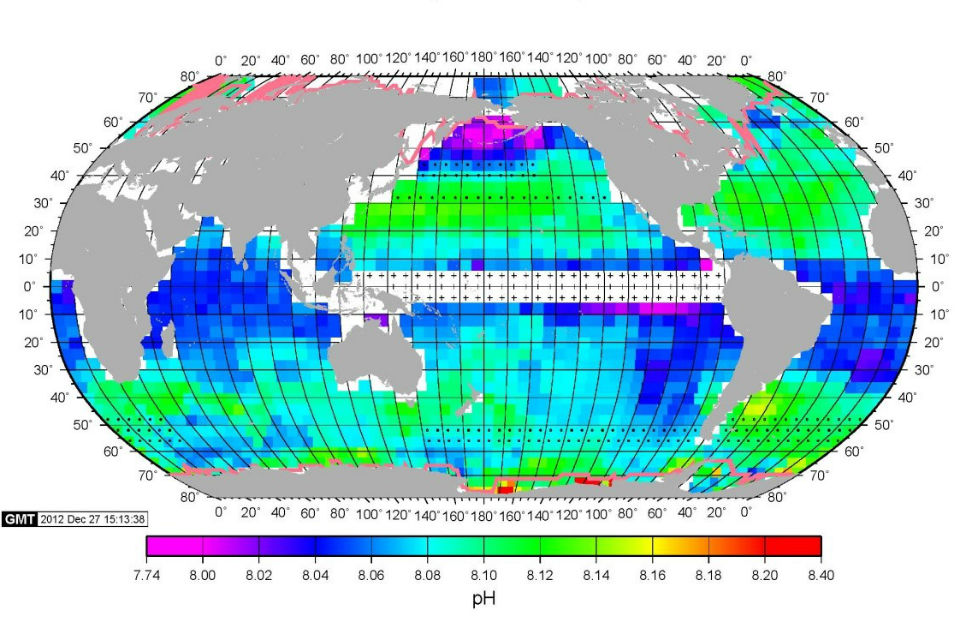
Here’s a map of pH values in February 2005. Click to embiggen.Takahashi
As you probably know, ocean acidification is the underwater flip side of our atmospheric emissions problem: The oceans have absorbed a quarter of the CO2 released into the atmosphere over the past 200 years. This has led to plunging pH levels (read: spiking levels of acidity) across the oceans as a whole, and in certain places more dramatically: The Indian Ocean is 10 percent more acidic than the Atlantic and Pacific, and the Bering Sea scores highest overall — as you can see from that scary purple blob above.
But the Bering isn’t that acidic all year. In addition to where, the charts also show when the oceans are more or less acidic — since month by month, pH values rise and fall at different parts of the ocean’s surface, with the largest fluctuations found in the waters off Siberia, Alaska, the Pacific Northwest, and Antarctica.
In addition to the where, the maps also show when the oceans are more or less acidic — since month by month, pH values rise and fall at different parts of the ocean’s surface, with the largest fluctuations found in the waters off Siberia, Alaska, the Pacific Northwest, and Antarctica. Blame massive plankton blooms that pull CO2 from waters in the spring and summer, causing seawater acidity to drop. Then winter brings CO2-rich upwellings from the deep, swinging the pH pendulum of surface waters back toward acidic.
We may not know how much the oceans will acidify in the long run, or how bad that picture looks — but for now this study paints a portrait of our rapidly souring relationship to the sea