Eric Salathé has been studying climate change since he was a graduate student at Yale back in the early Eric Salath�
At the time, he said, scientists pretty much understood the basics of global warming — that pumping greenhouse gases like carbon dioxide into the air would cause the atmosphere to absorb more solar radiation, which would cause temperatures to rise. That, in turn, would cause more water to evaporate from the oceans, which would increase the amount of water vapor in the atmosphere, which would then absorb more solar radiation, thus perpetuating the cycle of warming.
Eric Salathé, a professor of climate science at the University of Washington Bothell School of STEM.
What was less clear, Salathé said, was how that water vapor traveled around the globe high up in the atmosphere. He spent his time in graduate school and his first few years at UW studying those movements and making sure that global climate models properly accounted for them. But by 1998, he said, it seemed that many of the big questions about climate change had been answered. It was time to refocus.
“I started to say ‘OK, I can continue doing this, and we can argue about whether it’s 3 degrees of warming or 4 degrees of warming or 5 degrees of warming, but it doesn’t really matter whether it’s 3, 4, or 5 degrees of warming. It’s a problem.’”
Two years later, Salathé waded into the relatively new field of regional climate modeling, where instead of simulating conditions for the entire globe, he would zoom in on particular locations, producing more meaningful, localized predictions.
[grist-related-series]
Salathé focused on the Northwest, and by 2008, he and his colleagues completed their first 100-year simulation, using the Weather Research and Forecasting (WRF) model originally built by the National Center for Atmospheric Research.
The simulation took about six months to run and was a big accomplishment, Salathé said, but it was really just the beginning. Models, after all, aren’t crystal balls that deliver nice, complete pictures. Their original results are murky, and only after months and years of work do they morph into something useful.
Now, seven years and many runs of the model later, Salathé and his colleagues are starting to see that picture, and all in all, things aren’t looking so bad for Seattle, compared to some parts of the world. That said, the Emerald City is in for some unpleasant changes.

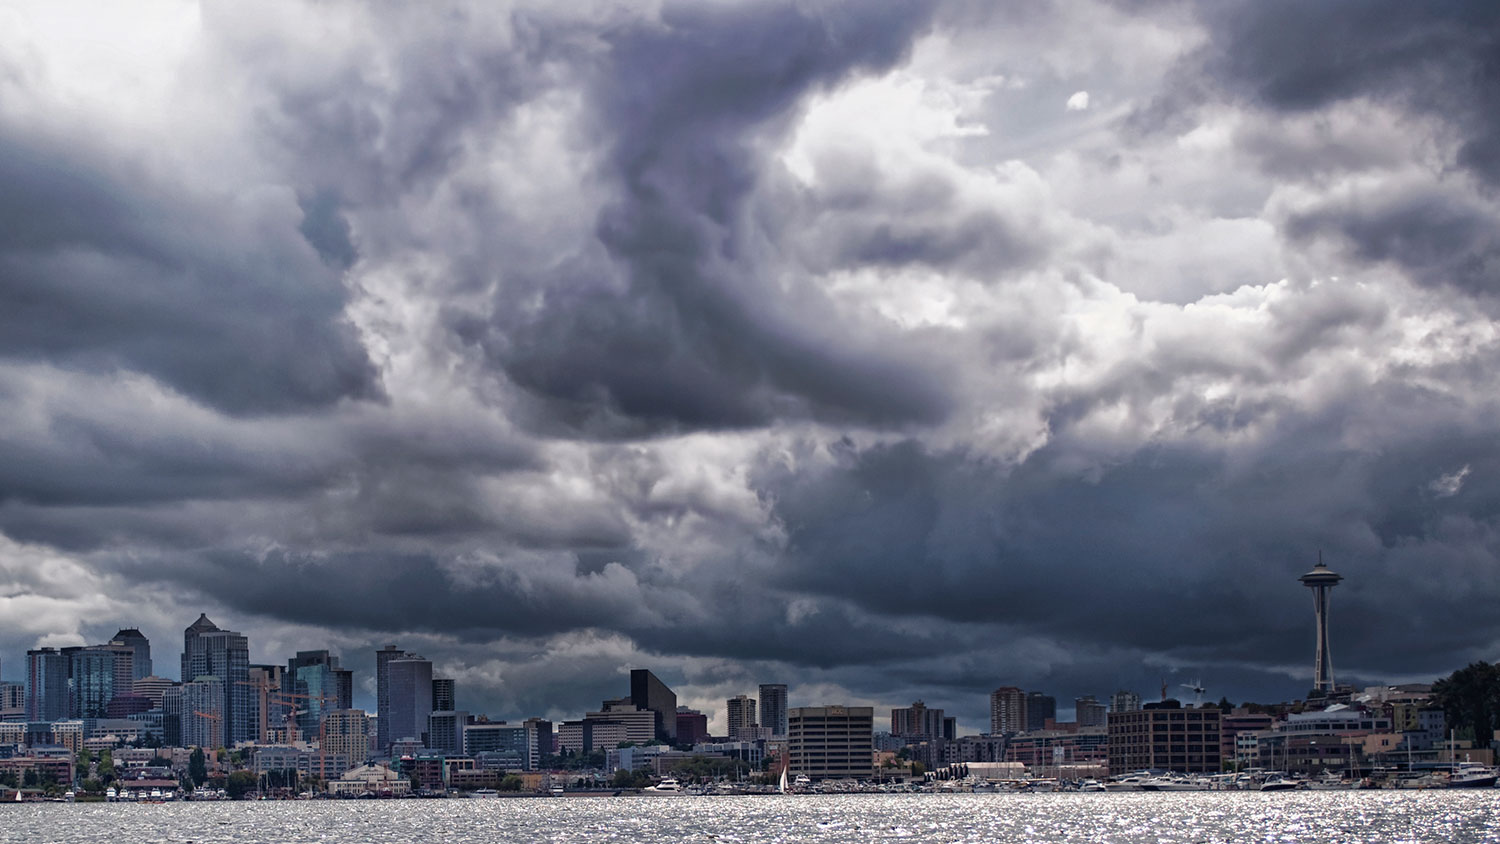
Stroll through Seattle on a clear day, and you’ll see the Cascade Mountains looming in the east, the Olympics out west, and — if you’re lucky — Mount Rainier to the south. Walk along the waterfront past Pike Place Market, the Great Wheel, and the ferry terminal, and you’ll feel the flow of the cool Pacific air that gives the city its famously temperate weather. And if you’re new to the area (like this reporter), you might notice an unusual amount of greenery blanketing the neighborhoods around downtown.
This complex and varied landscape is what makes Seattle so beautiful. It’s also what makes the city a unique challenge for climate modelers — not to mention weather forecasters, who are lucky, on any given morning, to get the afternoon’s weather right.
All climate models, whether they’re regional or global, break the earth’s surface into a grid. Inside every grid space, there’s an averaged-out approximation of what the earth actually looks like – elevation, vegetation, water vs. land, etc. The smaller the grid spaces, the better the picture (think 1980s Super Mario vs. 21st century Super Mario).
But because global models have to crunch massive amounts of data, they can only afford to break the earth into chunks between 60 and 300 miles wide. They can’t capture the complexity of a place like Seattle. Models completely miss Puget Sound, the roughly 10-by-100 mile, orca-infested water body just to the city’s west, for example. Some models, Salathé said, even mush Seattle into the “big blob” that represents the Rocky Mountains, which are actually about 300 miles to the east.
That’s where regional models come in. The model that Salathé uses breaks the earth into chunks about 10 miles wide, so it can capture Puget Sound, the Cascades and the Olympics, even changes in cloud cover (a notoriously difficult task) and soil moisture. And all of these details, it turns out, are crucial to accurately projecting the region’s future, because no matter how temperatures change, it’s how the local landscape responds to that change that really matters. For example, with early results from their model, Salathé and his colleagues were able to piece together a newly detailed view of how flooding and precipitation patterns are going to change in the Seattle area.
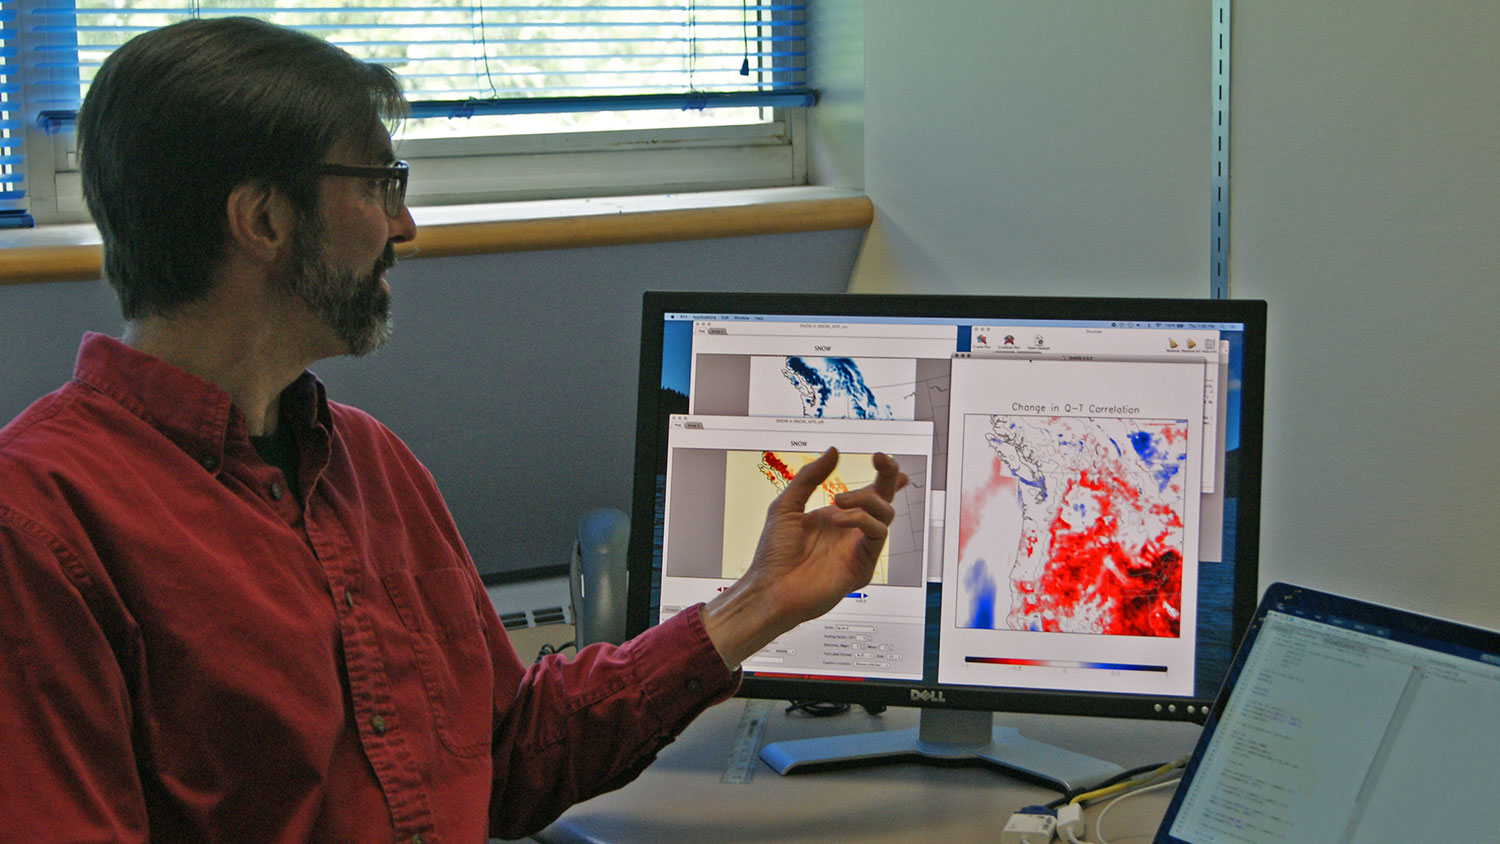
Eric Salathé, a professor of climate science at the University of Washington Bothell School of STEM, points to results from the WRF regional climate model.Grist / Amelia Bates
In 2013, the Climate Impacts Group at the University of Washington used Salathé’s results, among others, in a “state of knowledge” report laying out the future for Washington state. The prognosis is relatively mild — according to the report, it looks like the area west of the Cascades is going to be warmer, moderately drier in the summer, and a bit wetter in the winter — but it comes with some serious implications. Here’s the rundown:
By 2050, the state can expect the average annual temperature to increase between 4.3 and 5.8 degrees Fahrenheit, on average. That means more heat waves, and between one and 15 additional days of 90-plus heat per year by mid-century, compared to 1971-to-2000 levels — a potential public health problem for a region that’s never had much use for air conditioners.
In the winter, much of the snow that typically falls in the Cascades will start to come down as rain instead. Overall, the average April 1 snowpack is expected to decrease by between 38 and 46 percent by mid-century, and melting is projected to occur three to four weeks earlier on average. The low snowpack will likely lead to an epidemic of cranky skiers, but more significantly, changes in stream flow will put salmon populations in jeopardy and force the city to closely monitor its summer water supply.
Seattle will never get hurricanes, thanks to cool North Pacific waters, but downpours will become more common, as the number of days with more than one inch of rain increases by as much as 13 percent. “Atmospheric river” events will become more intense, as water-saturated, tropical air coming in off the Pacific rises along the western face of the Cascades, condensing into heavy rain. That means more storms like the Great Coastal Gale in 2007 that caused severe flooding, dozens of landslides, hurricane-force winds, and five fatalities due to avalanches in the Cascade Mountains.
When it comes to sea-level rise, Washington is in a less precarious position than, say, Florida, but depending on the area, the state can expect rises of between four and 56 inches relative to 2000 levels. In Seattle, sea-level rise will disproportionately affect low-income neighborhoods like South Park and Georgetown, as well as the Port of Seattle and the heavily industrial area along the Lower Duwamish River, which is home to a Boeing plant, steel foundry, cement manufacturer, metal recycler, and various other industries.
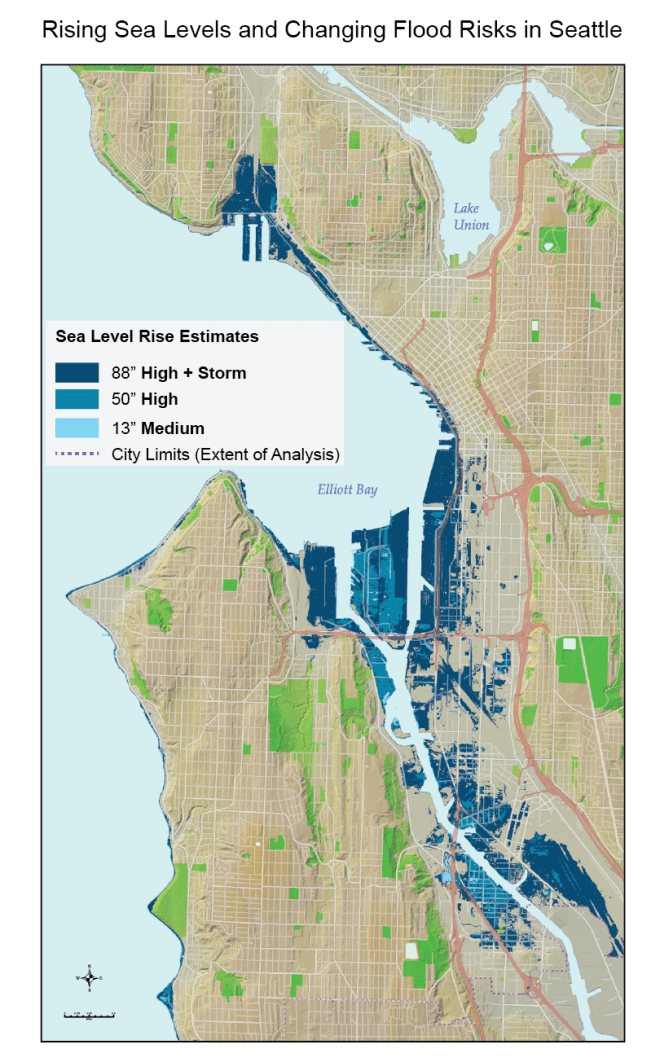
This map shows areas projected to be under sea level during high tide by 2100, assuming no adaptation.Seattle Public Utilities
And much to the dismay of local oysters, ocean acidity will likely increase by 38 to 109 percent by 2100.
All of this and much more is packed into the 100-plus-page report from UW, but there’s still a lot to learn, Salathé said. “We’re at the point where we know that there can be some really important regional effects that could make climate change much more locally intense in some places with much bigger consequences, but we don’t know the exact details.”
Cliff Mass, a professor of atmospheric sciences at the University of Washington, is currently trying to get enough funding together to support a fleet of regional models. It’s going to take a few dozen to really “do it right,” he said.
For now, Salathé and Amy Snover, director of UW’s Climate Impacts Group, have put together an online tool called Time of Emergence that is, in a way, the perfect culmination of what Salathé set out to do back when he left global modeling. Currently in beta testing, the tool is funded by the EPA and the U.S. Army Corps of Engineers and is backed by a “hideous amount of data” from the WRF and other models, Salathé said.
Once completed, the tool will allow anyone with web access to look up how and when 35 climate variables will change in 119 counties, 219 watersheds, and 96 streamflow areas across the Pacific Northwest over the course of this century. The variables fit into four categories: temperature, precipitation, hydrology, and streamflow. Users can tailor their searches to account for different emissions and management scenarios, and to make the results especially useful, the tool defines the “time of emergence” not simply as the time when these variables start to change, but as the time when these changes will become substantial enough that people will notice and decision makers will have to take action.
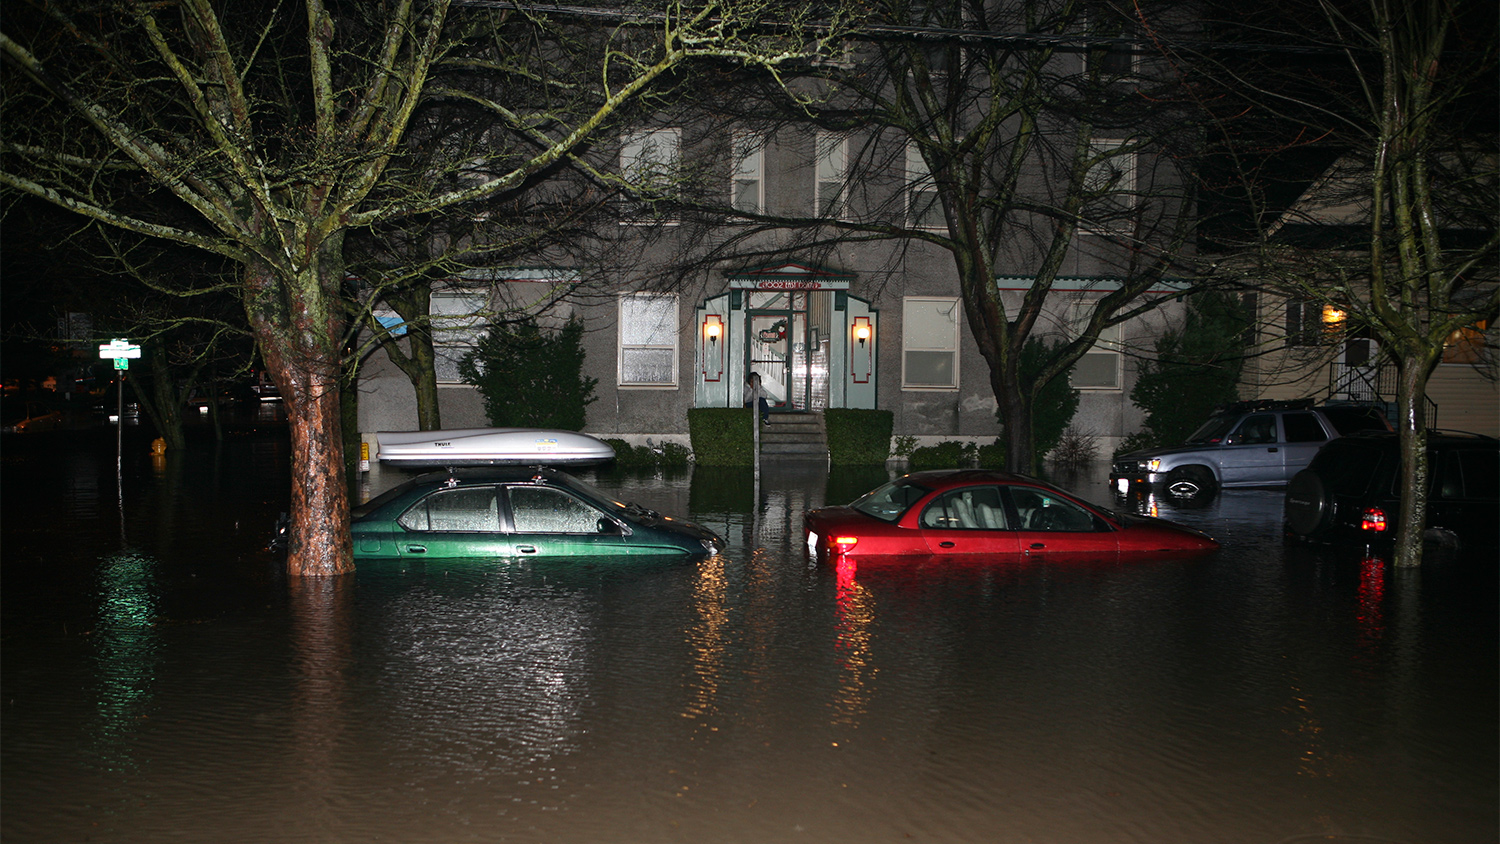
A flooded street in the Capitol Hill neighborhood of Seattle after a rain storm in December 2006. Elie Goral
One floor below Salathé’s office sits Lara Whitely Binder, the Climate Impact Group’s outreach and adaptation support specialist. Her job is to take the science flowing out of these models and deliver it to towns, cities, and tribes around the Northwest. With a background in public policy, she can help officials not only understand what lies ahead, but also prepare for it.
“I think Seattle is way ahead of a lot of communities,” Whitely Binder said. “The city leaders have said that planning for climate change is important, and we need to do it.”
But “way ahead” doesn’t necessarily mean ready. Seattle prides itself on being green, and in many ways, it is. Even as the city’s population has grown in recent years, per capita water use, energy use, and waste production have all gone down, and local officials have made a concerted effort to incorporate discussions of climate change into routine city business. Mitigation and awareness, however, are not the same as preparedness, and Megan Smith, an environmental policy advisor for King County, which encompasses Seattle, said that it’s time for this region to really focus on the latter.
For the county, that means putting together emergency action plans for extreme heat events, making sure cooling centers are available to especially vulnerable populations, equipping wastewater infrastructure along the shoreline to handle an influx of seawater, and planting more vegetation along rivers to shade and cool the water so it doesn’t get too warm for salmon.
In April, the county signed a $300,000 contract with UW to have a group of scientists, including Mass and Salathé, do an in-depth study on future precipitation patterns in the region. Officials plan to use the results to pinpoint vulnerabilities in storm water and wastewater infrastructure due to flooding.
Seattle Public Utilities (SPU), meanwhile, is trying to figure out how a city built for light rain is going to handle rising seas and heavy rain. James Rufo Hill is a meteorologist that the city hired after those record-breaking atmospheric river events back in 2007. For SPU, Rufo Hill said, dealing with climate change is all about predicting water flow.
Take this past winter, which was unusually warm. (Want to know what a typical winter will look like by 2070? “This is it! You just lived through it,” quipped Mass.) The city’s reservoirs usually don’t fill up with melted snow until around June 1, but this year, the precipitation came as rain rather than snow, and they filled up months in advance. That’s not a problem, Rufo Hill said, as long as the city “buttons up,” saving some of that water for later in the year, when it would usually have access to snowmelt.
Things get more complicated, however, when it comes to predicting how water from heavy storms will flow through the city itself. There are inlets all over the place and pipes and gutters of varying sizes — everything’s generally just “a lot more chaotic,” Rufo Hill said. SPU has 17 rain gauges throughout the city that monitor how much water enters the system and how much overflow there is, and it uses a tool called Seattle Rain Watch to track how much rain has fallen on the city within a 48-hour period, but ultimately, Rufo Hill said, the utility needs a more robust model of how water flows in the urban environment. The city will build bigger pipes and storage facilities where possible, he said, but it’s too expensive to do that everywhere.
That sentiment — that there’s only so much the city can do — is true in all areas of adaptation, because there’s never going to be a finished and complete picture of our changing world.
In Seattle’s 2013 climate action plan, there’s a long list of ways the city can prepare for its amorphous future. Many of the entries involve further research and assessment on how climate change will impact things like energy demand, food access, drainage systems, transportation infrastructure, and natural habitats. But there are also more concrete recommendations that include transitioning the city to a “smart grid” system, promoting urban agriculture, increasing storm water storage capacity, connecting floodplains with urban creeks, and improving precipitation monitoring.
Such a long to-do list raises the question: Is Seattle better positioned to withstand climate change than other parts of the world? In a lot of ways, yes — and Salathé, Mass, Whitely Binder, and Rufo Hill all said so in one way or another. But when it comes to the day-t0-day realities of climate change, relative terms are no more useful than global averages. The devil’s in the details, and for now, those details are still unclear.
“I’m often in a difficult position,”Salathé explained, “because I suspect there are things we should be worried about, but I don’t know the details of them, so I can’t really say this is what you should do about it.” Fortunately, he said, some of those details should emerge over the next few years as regional models improve. Still, we’ll never have a perfect crystal ball. Uncertainty, like our changing climate, is just part of life now.

