Cross-posted from Energy Self-Reliant States, a resource of the Institute for Local Self-Reliance’s New Rules Project.
Installed costs for solar PV have dropped, and economies of scale improved significantly in 2010, opening the door for much more cost-competitive distributed solar power.
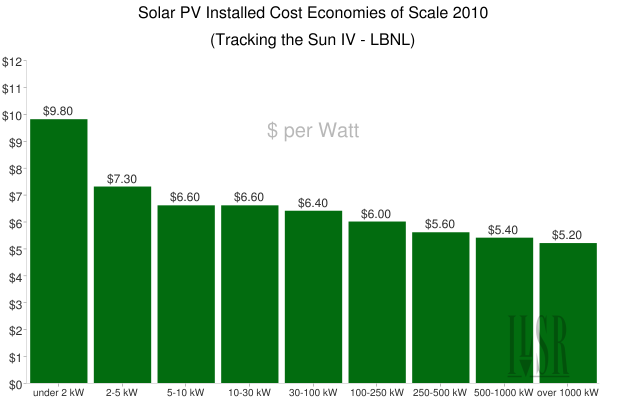
The data comes from the 4th edition of the excellent report from the Lawrence Berkeley National Laboratory (NBNL), Tracking the Sun [PDF], and shows the installed costs for behind-the-meter solar PV projects in 2010. The following merely copies Figure 11 from that report, showing the average installed cost of “behind-the-meter” solar projects in the U.S. in 2010, by project size.

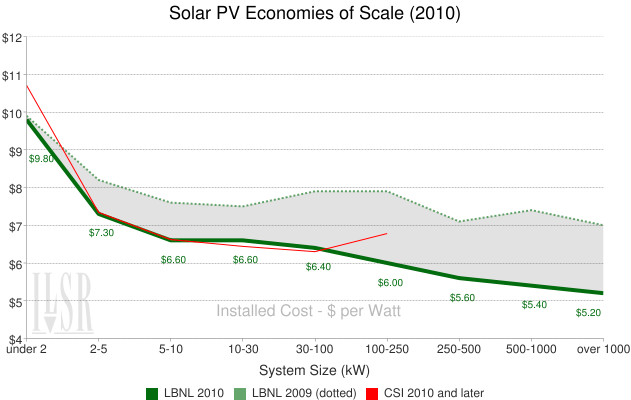
This is useful and shows the significant economies of scale for solar PV in 2010, but the history is important. For context, the following chart shows the 2010 data along with the 2009 data from LBNL, with the grey shaded area indicating the cost decreases. The 2010 installed cost data from the California Solar Initiative (CSI) is also shown in red, helping validate the LBNL data. The last data point from the CSI is an outlier, likely due to having too few projects in that dataset.

Two things are clear from the new data. First, installed costs have dropped significantly, by $1 per watt for residential-scale solar PV, and by nearly $2 per watt for megawatt (MW)-scale projects. We can also see more clearly how the economies of scale of solar have improved as well.
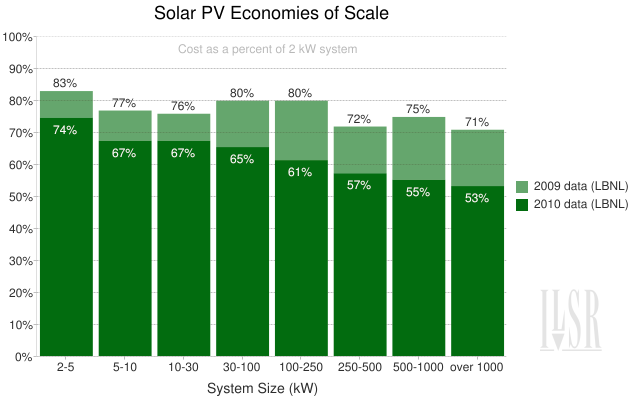
The unit cost savings between the smallest and largest solar projects (1 MW and under) jumped from $2.80 to $4.60 per watt, a change in relative savings from 30 percent to 47 percent. Economies of scale were also much greater for midsize solar (30-100 kilowatts), with the percentage savings over the smallest projects rising from 21 to 35 percent. The following chart illustrates the change in economies of scale, showing installed costs as a percentage of the cost of a 2-kilowatt (kW) system.

Instead of having relatively few economies of scale for solar PV projects larger than 2 kW, the 2010 data confirms that the unit cost of solar does continue to fall significantly as solar projects grow up to 1 MW in size.
Unfortunately, LBNL did not have sufficient data to provide context for economies of scale for larger distributed solar projects (one to 20 MW), with only about 20 data points. However, their finding was that these larger crystalline solar projects cost between $4 and $5 per watt, showing small but significant scale economies.
The lesson is that solar economies of scale seem to be improving as the U.S. market matures, good news for distributed solar to compete with peak electricity prices on the grid.
[Note: for more context, see this previous post on 2009 solar economies of scale.]


