What will the U.S. power mix look like in 10 to 20 years?
It’s impossible to predict for certain, of course, because there’s no way to know what regulators will do. Given the heavily regulated nature of the electric sector, even in so-called “deregulated” markets, surprises tend to come from regulatory reform, not innovation. (The U.S. electric grid has shown itself capable of rapid, large-scale transformation in response to regulations.)
Nevertheless, there is insight to be gained from thinking through how the generation mix would evolve in the absence of regulatory reform. Despite the lengthy time required to design, finance, and construct new generation facilities, it’s relatively easy to do so. The answers are not encouraging with regard to future grid reliability and price stability.
U.S. generation investments, 1990-2010
It takes one to two years to build a typical power plant (more like five for coal, and 10-20 for nuclear). There’s usually another year to fully commission and work out all the operating bugs. Add in a year or two on the front end to design and finance, and it’s safe to say that the generation mix for the next little while depends primarily on what’s already built.
Bearing in mind that we’re looking only at what has been built in response to the current regulatory environment, here are the top five sources of net capacity additions in the U.S. for the last 20 years. For context, the U.S. currently has about 1,000 gigawatts (GW) of installed capacity.
- Natural gas power plants: 315 GW
- Wind turbines: 37 GW
- Combined heat and power (CHP) plants: 36 GW
- Coal power plants: 12 GW
- Hydroelectric plants: 5 GW
Every other generation source added less net capacity over the last 20 years than hydro’s 5 GW. (Nuclear actually lost 1 GW of capacity during that period.) In and of itself, this is fascinating. For all the talk about coal and nuclear, they are essentially yesterday’s technologies.
However, think about what this means from a grid stability perspective. For the last century, the baseload, high-capacity-factor generation that has formed the backbone of the U.S. power system has consisted of coal, nuclear, and hydro. Over the last 20 years, those three sources combined have added less total capacity to the grid than gas, wind, or CHP individually. Of those, only CHP is a true baseload resource. Remove spare capacity margin in the coal/nuclear/hydro fleet, throw a bit of demand growth into the mix, and we are on a course for price spikes and/or outages.
U.S. electricity sources, 1990-2010
Let’s look at the same history in terms of energy produced rather than capacity installed. Values shown are the relative change in billions of kilowatt-hours (kWh) generated over the interval shown; again, only the top five sources are listed.
| 1989-2000 | 2000 – 2010 | 1989 – 2010 | ||||
| 1. | Coal | 357 | Natural gas | 377 | Natural gas | 509 |
| 2. | Nuclear | 225 | Wind | 89 | Nuclear | 278 |
| 3. | Natural gas | 133 | Nuclear | 53 | Coal | 245 |
| 4. | CHP | 122 | Other | 6 | CHP | 123 |
| 5. | Biomass | 14 | Geothermal | 2 | Wind | 93 |
Several observations:
First, the significant contribution from coal and nuclear over the last 20 years is unsustainable in the absence of investments in new generation — which clearly isn’t happening. So long as the coal and nuclear fleet had unused capacity lying around, it could increase output without investment, but that gig is up. Coal was the top source of generation from 1989 to 2000, and irrelevant in the subsequent decade. Nuclear didn’t fall quite as far, but is on the same trajectory.
Second, the ’00s really sucked. Load growth fell so far that new generation from “other” cracked the top four — thus the breakout into two decades in the table above, to better show the recession-specific impacts on generation growth.
Third, note that of the top sources of new generation over the last decade, only gas and wind were also among the top sources of new capacity. The difference between the 1990s and 2000s is striking: Load growth in the first decade was dominated by historically baseloaded sources, but load growth in the second decade came almost entirely from historically intermittent sources. When the wind blows and gas is cheap, that’s fine, but if there’s anything absolutely certain about the future, it’s that weather and gas prices will be variable. We are rapidly losing the ability to mitigate that volatility.
The silver lining here should be CHP; uniquely among the sources on the list, it was one of the top sources of new capacity over the last 20 years, and is a baseload asset. So why did it disappear in the ’00s as a source of new megawatt-hours (MWh)?
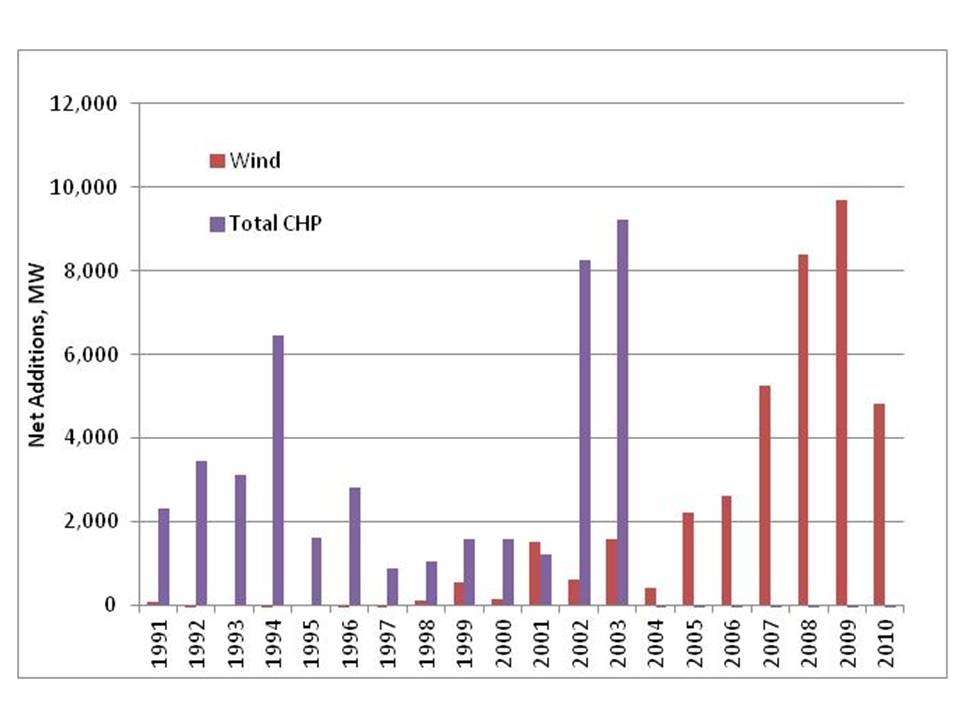
Here are the year-on-year capacity additions for wind and CHP:
 Click for larger version.
After gas, these are the two biggest sources of new capacity from 1990-2000, but it is the tale of two technologies and two decades. What happened?
I’ve not seen anyone look at this data before, so any effort to explain the transition is conjecture on my part. But here’s a couple guesses, based on my experience running CHP businesses during this time period and (at various times) raising equity from energy investors who spanned all generation technologies:
- For fueled CHP (e.g., excluding CHP from waste heat recovery), natural gas has long been the fuel of choice, because it’s so much easier to permit than oil or solid-fuel plants. When the “gas boom” took off in the 2000s (see the third graphic here), bringing billions of dollars of investment into gas-fired power plants, gas-fired CHP also took off. This accounts for almost all of the 2002-2003 spike in CHP deployments. When natural gas prices rose in response to all that new demand, investment in all gas-fired projects fell, explaining the 2004 crash.
- The 2005 Energy Bill (which was in the works through much of 2004) effectively killed the Public Utility Regulatory Policies Act (PURPA), which had for the previous 25 years required that utilities purchase all of the output of qualifying facilities (including CHP) under long-term contract. The 2005 “Boucher compromise” deemed that PURPA was no longer necessary in any competitive power market, defined to mean any jurisdiction with wholesale spot markets. The record shows how flawed that theory was — in the absence of long-term contracts, CHP didn’t get built.
- By contrast, just as the sun was setting on long-term contracts for CHP, it was rising on wind. The wind production tax credit (PTC) was first established in the 1992 EPACT, and a wave of states passed renewable portfolio standards (RPS) starting in the mid-1990s, mandating the purchase of renewable energy, typically under long-term RPS contract.
For a brief period in the late ’90s and early ’00s, both CHP and wind had access to long-term energy off-take agreements. Cleantech investors pursued both. But in 2005, the relative risk profile shifted in wind’s favor and capital moved accordingly. That’s a lesson far too often lost on market purists who insist that the presence of spot markets is all you need to invest capital, and on policymakers who want to encourage private sector investment in a diverse set of generation technologies.
So where will future kWh come from?
The answer is fairly obvious: electric-only gas-fired power plants. We’ve built a ton of capacity that doesn’t run very often. So long as we can continue to ramp up natural gas production, we’re going to be generating a lot more power from natural gas 20 years from now than we are today.
The also obvious but more surprising answer is not coal and not nuclear. Yes, the existing assets will continue to run, but we’re not going to get much more output from those plants unless we build new plants, and the cost and schedule overruns innate to the modern coal/nuclear plant (not to mention pending environmental regulations) make it a virtual certainty that for the next 20 years, retirements of coal and nuclear will outpace additions. They will become proportionally less significant sources of the U.S. electricity mix.
Wind will continue to grow so long as we continue building new wind power plants. (Unlike gas, wind will generate at full capacity if built, so the only way to grow total output is to keep building.) Subject to preservation of PTCs and state renewable standards, investors will continue to finance new wind projects, but we’re already running into physical constraints on the amount of intermittent wind that local grids can handle. While those constraints could theoretically be solved with a massive investment in transmission, we’ve shown no ability to build transmission at any meaningful rate in the current regulatory structure. I don’t know where those limits lie, but recent announcements suggest that the Pacific Northwest and Midwest are already at or near physical limits; if wind is to continue its growth, it will probably have to find ways to be deployed on less wind-intensive parts of the national power grid.
Absent changes to the current policy environment, it’s hard to make the case that anything else is going to be a meaningful contributor to new MWh. That’s not to say that there isn’t potential for other technologies, or that other technologies wouldn’t be better choices. It’s also not to say that there won’t be lots of people deploying lots of capital in solar, CHP, geothermal, and biomass over the next 20 years. Rather, it is to note that at a macro level, if we want those other sources to be among the top five sources of new capacity 20 years from now, we need a fundamental overhaul of electricity regulation.
The irony is that if we stay the current course, gas demand and electricity prices will rise and grid reliability will be compromised. All of that will increase the value proposition for other clean, local generation options. It would be nice to see that outcome result from proactive policy choices today instead of reactive markets 10 years from now.