As has been seen year after year, the warming of the Earth is causing major changes in many aspects of the planet’s climate, and 2014 was yet another year that showed this trend in stark relief, a report released Thursday says.
Numerous records were broken last year, according to the State of the Climate report, an annual checkup of the global climate published in a special issue of the journal Bulletin of the American Meteorological Society.
Now in its 25th year, the report pulls together hundreds of scientists from dozens of countries to piece together the changes from the previous year in all aspects of the Earth’s climate — from carbon dioxide levels to the planet’s rising temperature, from glacier melt to change in soil moisture — and puts them in the context of decades-long trends.
Here are four key points to draw from the report:
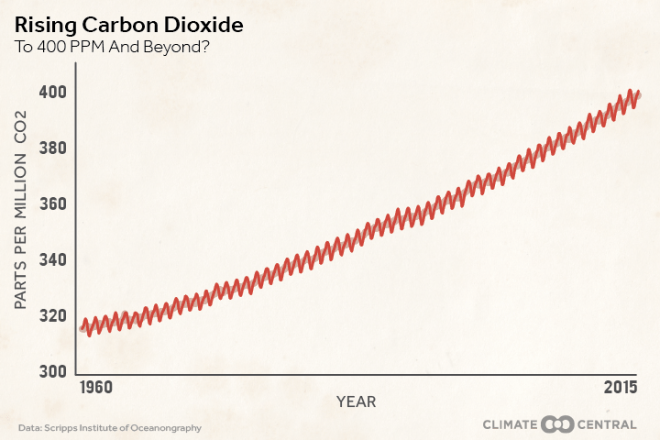
Carbon dioxide levels are rising: This is the trend that underlies global warming, as it is the rise of carbon dioxide and other greenhouse gases from human activities — first recognized in the famous Keeling Curve — that is driving the rise of Earth’s temperature. CO2 levels have been “increasing throughout the recent decades and 2014 was no different,” Deke Arndt of the National Centers for Environmental Information, part of the National Oceanic and Atmospheric Administration, said during a press call.
The global average carbon dioxide level reached a new record high of 397.2 parts per million last year, a nearly 2 ppm rise from 2013 and a 40 percent increase from preindustrial levels. The average for three months of last year — April, May, and June — was above 400 ppm; that level will likely be exceeded for many more months this year.
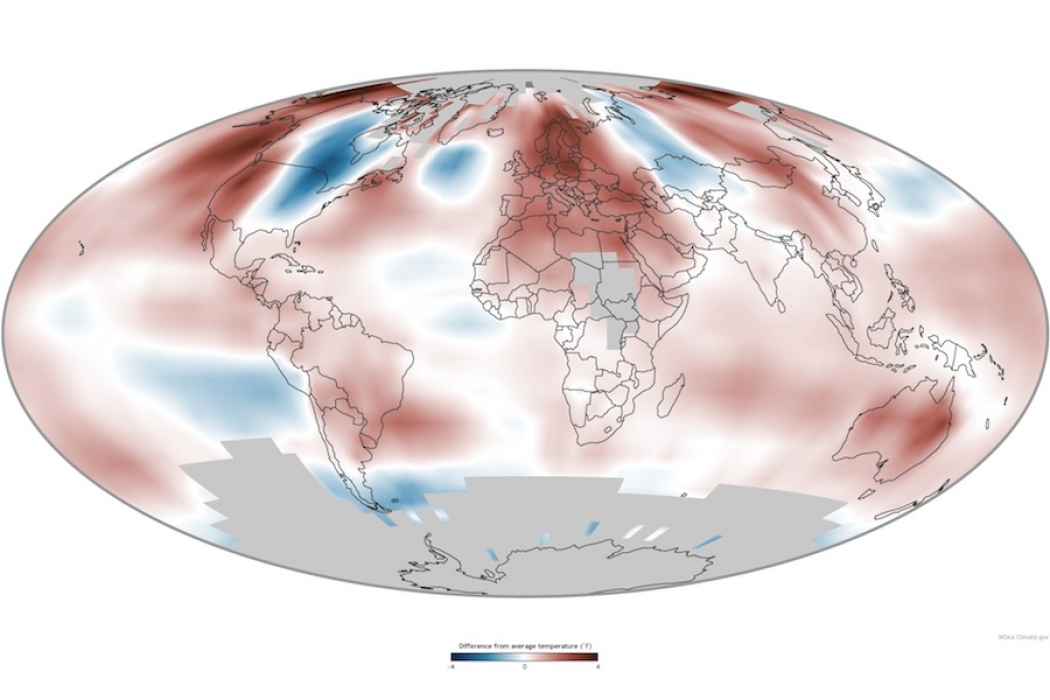
How average temperatures in 2014 compared to the 1981-2010 average, shown as differences in degrees Fahrenheit, with red showing warmer and blue cooler temperatures. Click to embiggen.NOAA
Earth’s temperature is rising: A direct consequence of the build-up of greenhouse gases is a steady rise in Earth’s average temperature from all the excess heat those gases trap and prevent from escaping out into space. Arndt called this temperature rise “one of the most obvious connections to a changing climate.”
Four datasets of global temperatures ranked 2014 as the warmest year on record (or tied for warmest) going back to 1880. A Climate Central analysis showed that 13 of the hottest 15 years on record have all occurred since 2000 and that the odds of that happening randomly without the boost of global warming is 1 in 27 million.
The year was also the warmest on record for particular regions, from California to Europe. A separate Climate Central analysis showed that warming made that record for Europe 35 to 80 times more likely.
Another aspect of the warming trend is the increase in the hottest days and the decrease in the coldest nights, which the new report showed was a trend that continued in 2014.
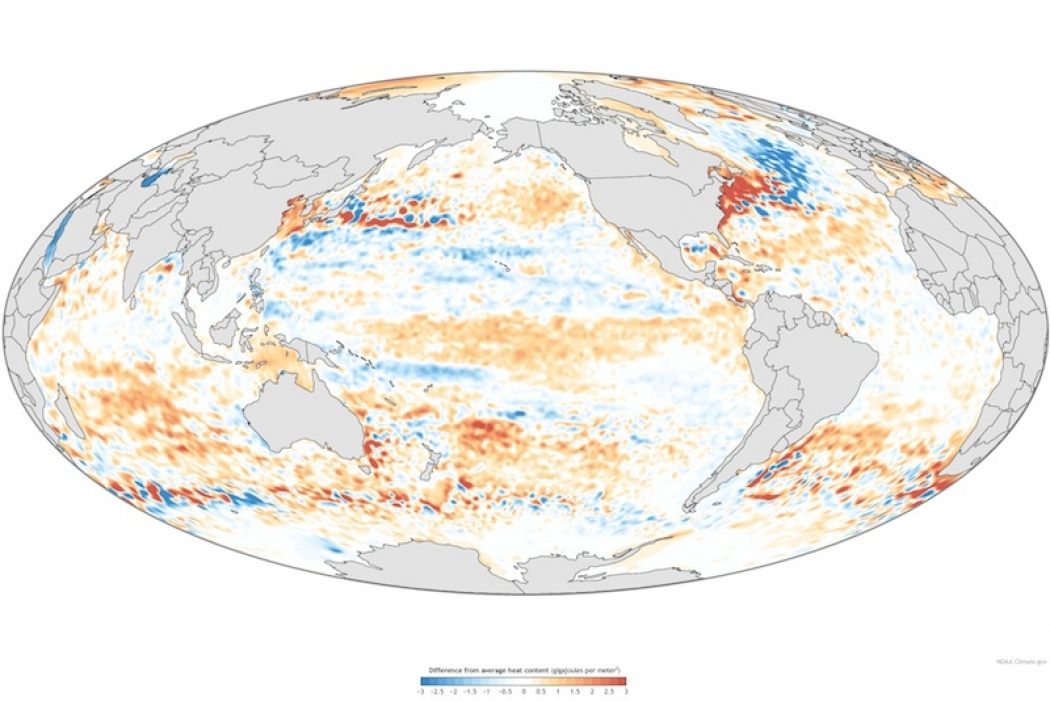
How the heat content of the upper 2,300 feet of the Earth’s oceans differed from the 1993-2014 average. Click to embiggen.NOAA
The oceans are heating up: Not only was Earth’s temperature record warm in 2014, but so were the global oceans, as sea surface temperatures and the heat of the upper oceans also hit record highs. “The heat content is just continuing to pile up,” Greg Johnson, an oceanographer at NOAA’s Pacific Marine Environmental Laboratory, said during the call.
This trend is key because the oceans absorb about 93 percent of all the excess heat trapped by greenhouse gases. “You can kind of think of ocean warming as being global warming,” Johnson said.
The North Pacific in particular was exceptionally hot, and the tropical Pacific moved toward an El Niño state, which features warmer-than-average waters in that region.
All of that heat in the oceans also raised global sea levels to a new record high, more than 2.5 inches above what it was in 1993, as water expands as it heats up.
Overall, ice is melting: All the excess heat in the Earth system, both at the surface and in the oceans, has contributed to the steady disappearance of the planet’s ice, including Arctic sea ice, mountain glaciers, and permafrost.
The area of the Arctic Ocean covered by sea ice in September, when the annual minimum occurs, was the sixth lowest extent in the satellite record, going back to 1979. The eight lowest extents in that record have all occurred within the past eight years, the report notes. “So there’s a definite recent decline in sea ice,” Jessica Blunden, a climatologist with ERT, Inc. at NCEI and the lead editor of the report, said.
Added to that is the melt of glaciers around the globe. A survey of three dozen index glaciers showed that 2014 was the 31st consecutive year of overall glacier ice lost. Since 1980, this melt has effectively lopped off 60 feet of ice from the top of each glacier, Blunden said.
Permafrost, the permanently frozen soils found in land areas of the Arctic, have also been melting. Several stations in the North Slope of Alaska and the Brooks Range had record or near-record high temperatures in the permafrost at depths of about 65 feet, showing how much the warming is affecting the Arctic environment.
While each of these components of the Earth’s system tells a part of the story of the warming planet, together they combine into a powerful narrative of the planet’s plight.
“It’s the whole global climate system,” NCEI director Thomas Karl said. “These things are all intricately linked to each other.”