If any image has singularly captured the public’s attention during the coronavirus pandemic, it has been The Curve. The graph charts the incidence of new cases — and by extension, the use of hospital resources. The rush to flatten its peak ensures health care systems won’t be overwhelmed by a deluge of COVID-19 patients.
As environmentalists strive to draw lessons from the coronavirus response, some have paused to consider whether climate science offers any analogous chart in need of leveling. The activist and author Bill McKibben, for example, writing for the New Yorker, notes that people have “emitted more industrial carbon since 1988 than in all of prior human history, utterly failing to flatten the curve. (In fact, we call the diagram that outlines our dilemma the Keeling Curve, and it just keeps rising.)”
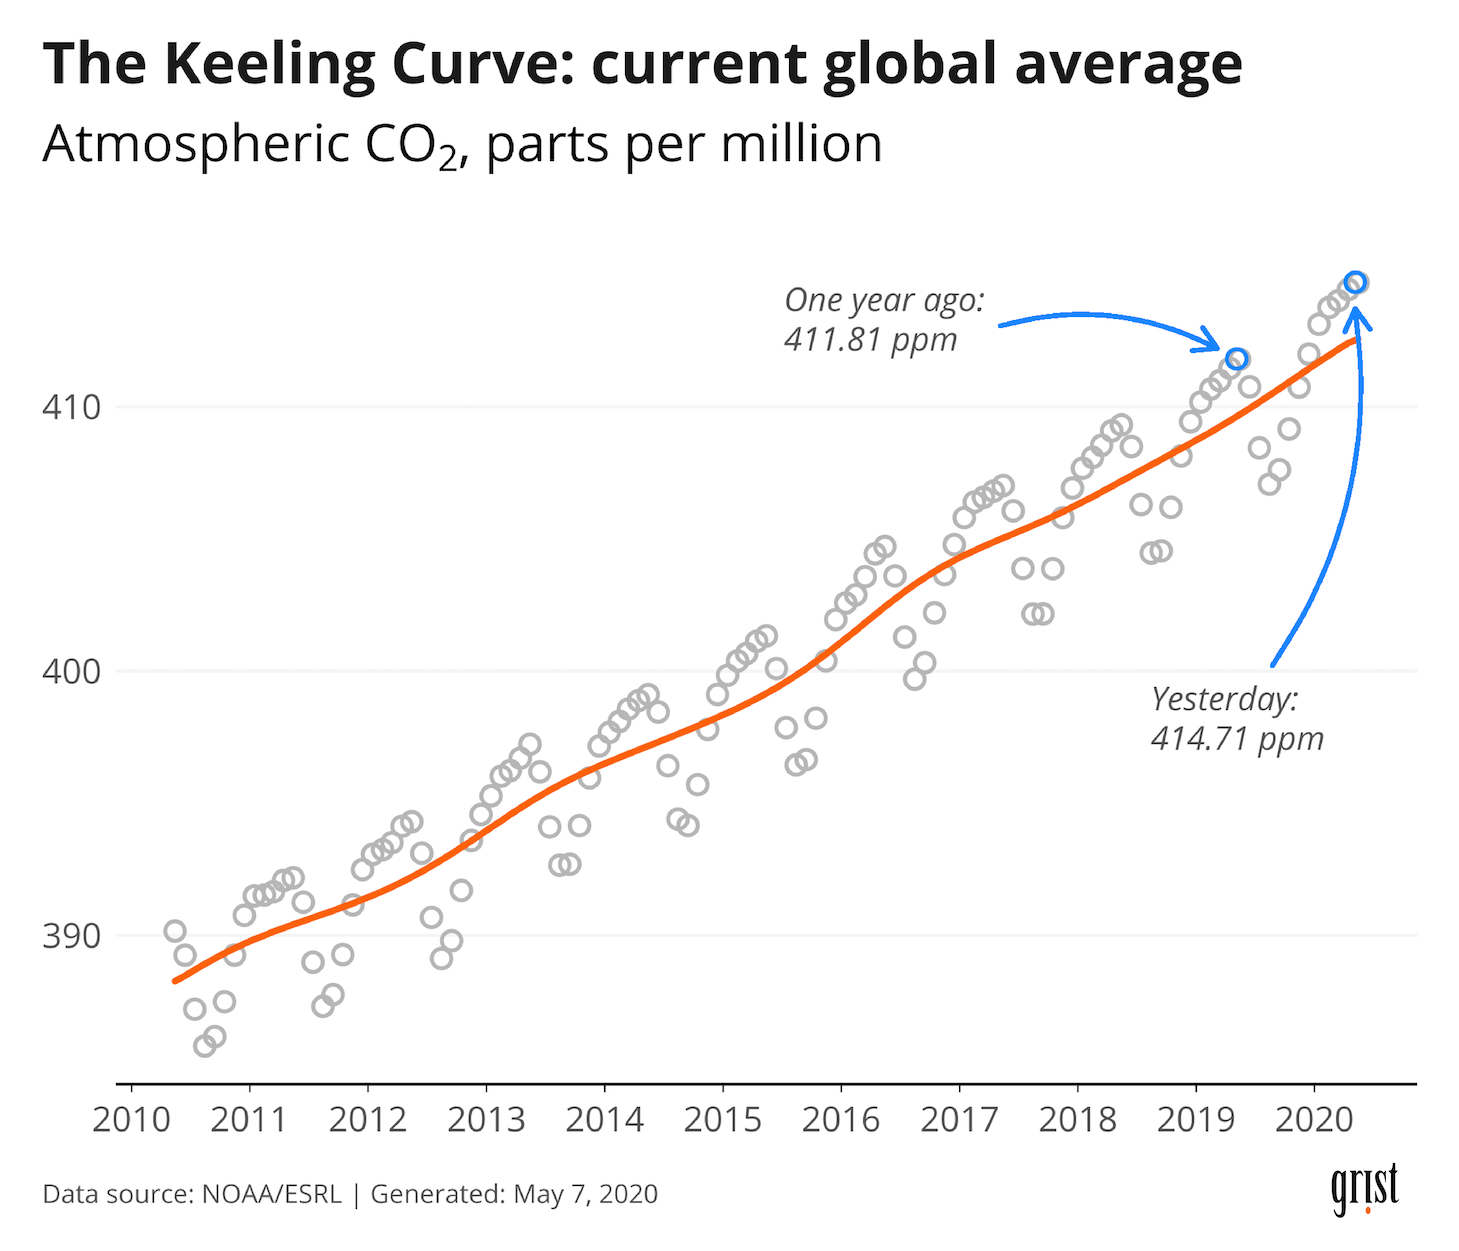
Clayton Aldern / Grist
The Keeling Curve, while offering a useful benchmark for grappling with that other global calamity, is no climate corollary to the COVID curve. Rising atmospheric carbon dioxide is an effect of the behaviors that worsen climate change. We want the cause.
Undoubtedly, the most immediate driving force behind rising atmospheric carbon dioxide levels is our collective release of the greenhouse gas itself — our emissions. And climate scientists have already told the world what we must do to limit global warming to 2 degrees Celsius (3.6 degrees Fahrenheit), the point at which we’ll begin to see the worst climate change has to offer: We must adhere to a carbon budget.
The science doesn’t really care how we keep ourselves from exceeding that budget. Electrify everything. Bury your carbon. Put trees on blimps. Just keep the cumulative global sum of carbon dioxide emissions to 1,290 gigatons between 2018 and 2100, and we’ll have a two-thirds chance of limiting warming to 2 degrees C. Those are the rules.
Robbie Andrew, a researcher at the Center for International Climate Research in Oslo, Norway, has been tracing future emissions curves that are consistent with this budget. In 2014, he and his colleagues published a paper in Nature Climate Change contemplating how to fairly divide up the remaining carbon emissions. Tucked away in the paper’s supplemental material was a mathematical illustration of the pain that would be brought on society by delaying climate action. When you’re constrained by a budget, every passing year of over-emitting requires a sharper curtailing of pollution in the years to come. Taking action lowers the peak and makes for a more gentle decline over the rest of the century.
Clayton Aldern / Grist
The bad news: The world has probably already blown past the period when we could have drawn down our emissions at a leisurely rate. If global emissions had peaked a little after the turn of the millennium, we could have gotten by with reductions of around 2 percent annually. But they didn’t. They’re still rising, and the annual reduction required now is closer to 7 or 8 percent — on par with the decrease in emissions we’re seeing with the world on coronavirus lockdown.
In each mitigation case, the area under the future-emissions curve is the same. (That’s the carbon budget.) But climate procrastination requires back-to-back all-nighters to catch up.
Now say we wanted to limit global warming to a 1.5-degree Celsius (2.7-degree Fahrenheit) world — at which point we’ll still see more coastal flooding, stronger storms, and longer droughts. The curve is even more intimidating. To keep from crossing this more conservative threshold, the U.N. climate panel calculated the 1,290-gigaton budget dropped all the way down to 463 gigatons. Last year, we burned through another tenth of that allotment, leaving the current balance around 419 gigatons. With a few more years of inaction, an already steep descent morphs into a cliff.
Clayton Aldern / Grist
The beauty of the coronavirus curve, if there is any beauty to be found in it, is that the chart captures what happens over time due to policy responses, but it’s agnostic to the specific policies themselves. The point is: If communities limit the spread of the virus and distribute its incidence over time, hospitals won’t be overwhelmed. Mitigation curves tell a similar story, but the story here is about more than health systems. The steeper curve generated by delaying climate action overwhelms whole economies — and imaginations — as we struggle to wrap our heads around (and implement) what it would take to cut emissions by, say, 20 percent every year.
Since we can’t go back in time, it’s tempting to imagine alternatives to flattening the climate curve that don’t rely on rapid action. The scenarios outlined in the accompanying graphs here, for example, show the world leveling out at net-zero emissions. But there’s no reason we’d need to stop at zero.
To achieve emissions reductions at the rates required to avoid breaking the carbon bank, we’ll likely need to roll out technologies that vacuum up, capture, or otherwise sequester carbon dioxide, whether from the atmosphere or as it’s emitted in the first place. The more quickly we scale up these technologies, the more time we’ll buy ourselves to bring down our actual emissions.
And why stop there? If our curve of net emissions dips below the zero line, we’ll have longer yet to transition to economies that emit less carbon. (Each of the main emissions trajectories laid out in the U.N. climate panel’s October 2018 report on 1.5 degrees C of warming relies on periods of net-negative emissions after about 2050 to keep global temperatures hovering around that threshold long-term.)
According to Andrew, however, counting on negative-emissions technologies might be dangerous. For one thing, you’re not flattening the mitigation curve: You’re just broadening it. It’s like a variable-rate loan for subprime borrowers: You’re allowed a low rate for now, but at some point, your rate is going to skyrocket. In all cases, we’re going to have to figure out how to slash net emissions precipitously at some point to avoid surpassing the carbon budget.
The high-negative-emissions scenario “also quite likely results in overshoot — that temperatures will exceed our ‘target’ and then come down again,” Andrew told Grist. “In the language of flattening the curve, this is precisely the opposite of what we want. Overshoot of temperatures is directly equivalent to overwhelmed hospitals.”
True flattening, then, only ever translates to a lower, earlier emissions peak — another case for acting now as opposed to waiting for breakthrough innovations to fix the world’s climate woes. “It is partly this hope in future technologies — technological optimism — that delays action,” Andrew writes on his website.
In other words, while some might feel like we’re driving toward a solution, we’re also coming up on the edge of a cliff. And it’s a long way down.