infographic
-
Infographic: Fracking violations in Pennsylvania
The orange dots here are natural gas extraction operations with one or more environmental violations. But, you know, deer and rainbows! Click through to NPR's interactive graphic to find out more about each operation and how many laws they're flouting. (You can also get more detailed maps and information by county.)
-
Cool map shows density at a glance
The pixels on Fathom Information Design's Dencity map get smaller the more people they represent — meaning that sparsely-populated areas are low-resolution, and densely-populated ones are sharp and bright. It illustrates both the positive and negative aspects of density: Each pixel gets less space the more pixels there are, but that means that denser areas […]
-
Interactive map shows hybrid and electric car sales in your area
See the map This interactive map from NPR, which shows hybrid and electric car sales figures across the U.S., is a handy way of calculating the hippie concentration of your area at a single glance. But it also might help predict which areas will get EV infrastructure soonest, because of high demand. Also, it's kind […]
-
XKCD illustrates the cost of electricity
The webcomic XKCD usually has pretty stripped-down images, and saves its complexity for the jokes. But when creator Randall Munroe gets his hands on some data, he can make an infographic you could get lost in. The above (click to embiggen) is just a tiny section of his epic chart comparing how much money gets spent […]
-
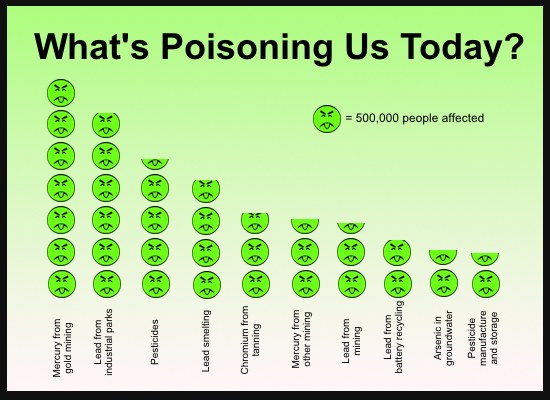
Infographic: The top toxic health hazards
We figured this depressing Scientific American article about the top 10 pollution-related health hazards deserved the Onion-style infographic treatment. Here are the actual numbers for how many people are being sickened or killed by toxic pollution worldwide: Mercury pollution from gold mining (3.5 million people) Lead pollution from industrial parks (nearly 3 million) Pesticides from […]
-
Graphic: The sad state of American forests
The New York Times has an interactive infographic about the state of forests worldwide. Here's North America. The orange area has been decimated by the mountain pine beetle — warmer winters mean the beetles live longer and simultaneously make the trees more vulnerable. And the bright red spots lost between 20 and 88 percent of their […]
-
Take a look at what we’ve done to fish populations
This image from Information is Beautiful (click to embiggen) shows the biomass of popularly-eaten fish (bluefin tuna, striped bass, all the ones you normally see in restaurants) in the northern Atlantic. On the left is 1900 — look at all that blue! Blue means 11 or more tons of fish in a given area. On […]
-
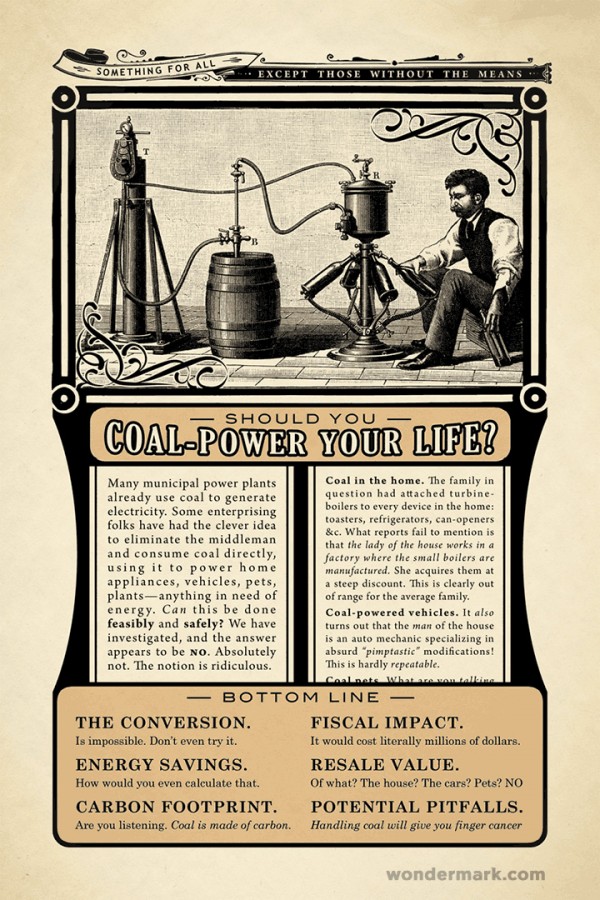
Infographic: Should you coal-power your life?
More reasons to avoid coal, courtesy of David Malki ! of Wondermark: Made of carbon Finger cancer Costs literally millions of dollars Absurd "pimptastic" modifications Impossible
-
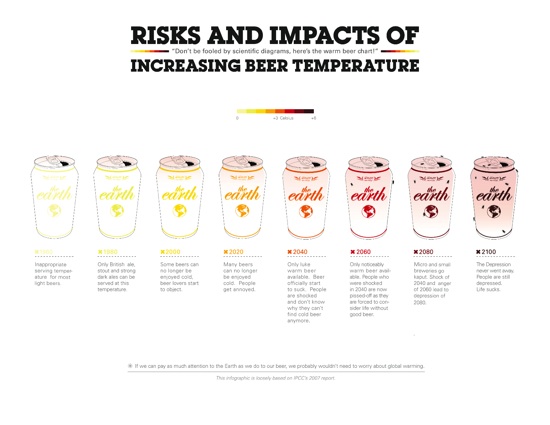
How to explain climate change to Joe Sixpack
(click to embiggen) Look, not everyone's motivated by the threat of extreme weather events, rising sea levels, and threatened habitats. But nobody likes warm beer. Use this chart to put climate change in perspective for the beer guzzler in your life. (Note: Will not work in Britain.)


