The average American household spends a little more than 3 percent of its income on energy bills. Economists and other experts call that measure a family’s energy burden, and, predictably, it tends to go up when you look at lower-income communities. Some neighborhoods in Atlanta experience energy burdens close to 10 percent — typically areas where there are more Black residents, more renters, and higher rates of asthma, diabetes, and other ailments. That’s according to maps produced by Greenlink Analytics, a nonprofit that works with cities nationwide to develop climate and equity strategies based on data.
Yeou-Rong Jih, the organization’s director of urban initiatives, discovered Greenlink while she was helping write Atlanta’s 100 percent clean energy plan for the Mayor’s Office of Resilience. Although the stats weren’t too different from what she’d expect, seeing them play out on a map was eye-opening. “It really forced the conversation to turn more toward creating energy equity,” Jih says, “and making sure that things like solar and energy-efficiency programs didn’t just go to the highest-income people, but instead created an equitable transition for everybody.”
The insights gleaned from Greenlink’s data prompted the city to seek funding for an energy-efficiency program that will offer energy audits and some basic home improvements in the highest-burden neighborhoods. The Mayor’s Office and the chief sustainability officer also created a clean energy advisory board to bring together community representatives, NGOs, and Georgia Power to determine the best path toward 100 percent sustainable energy.
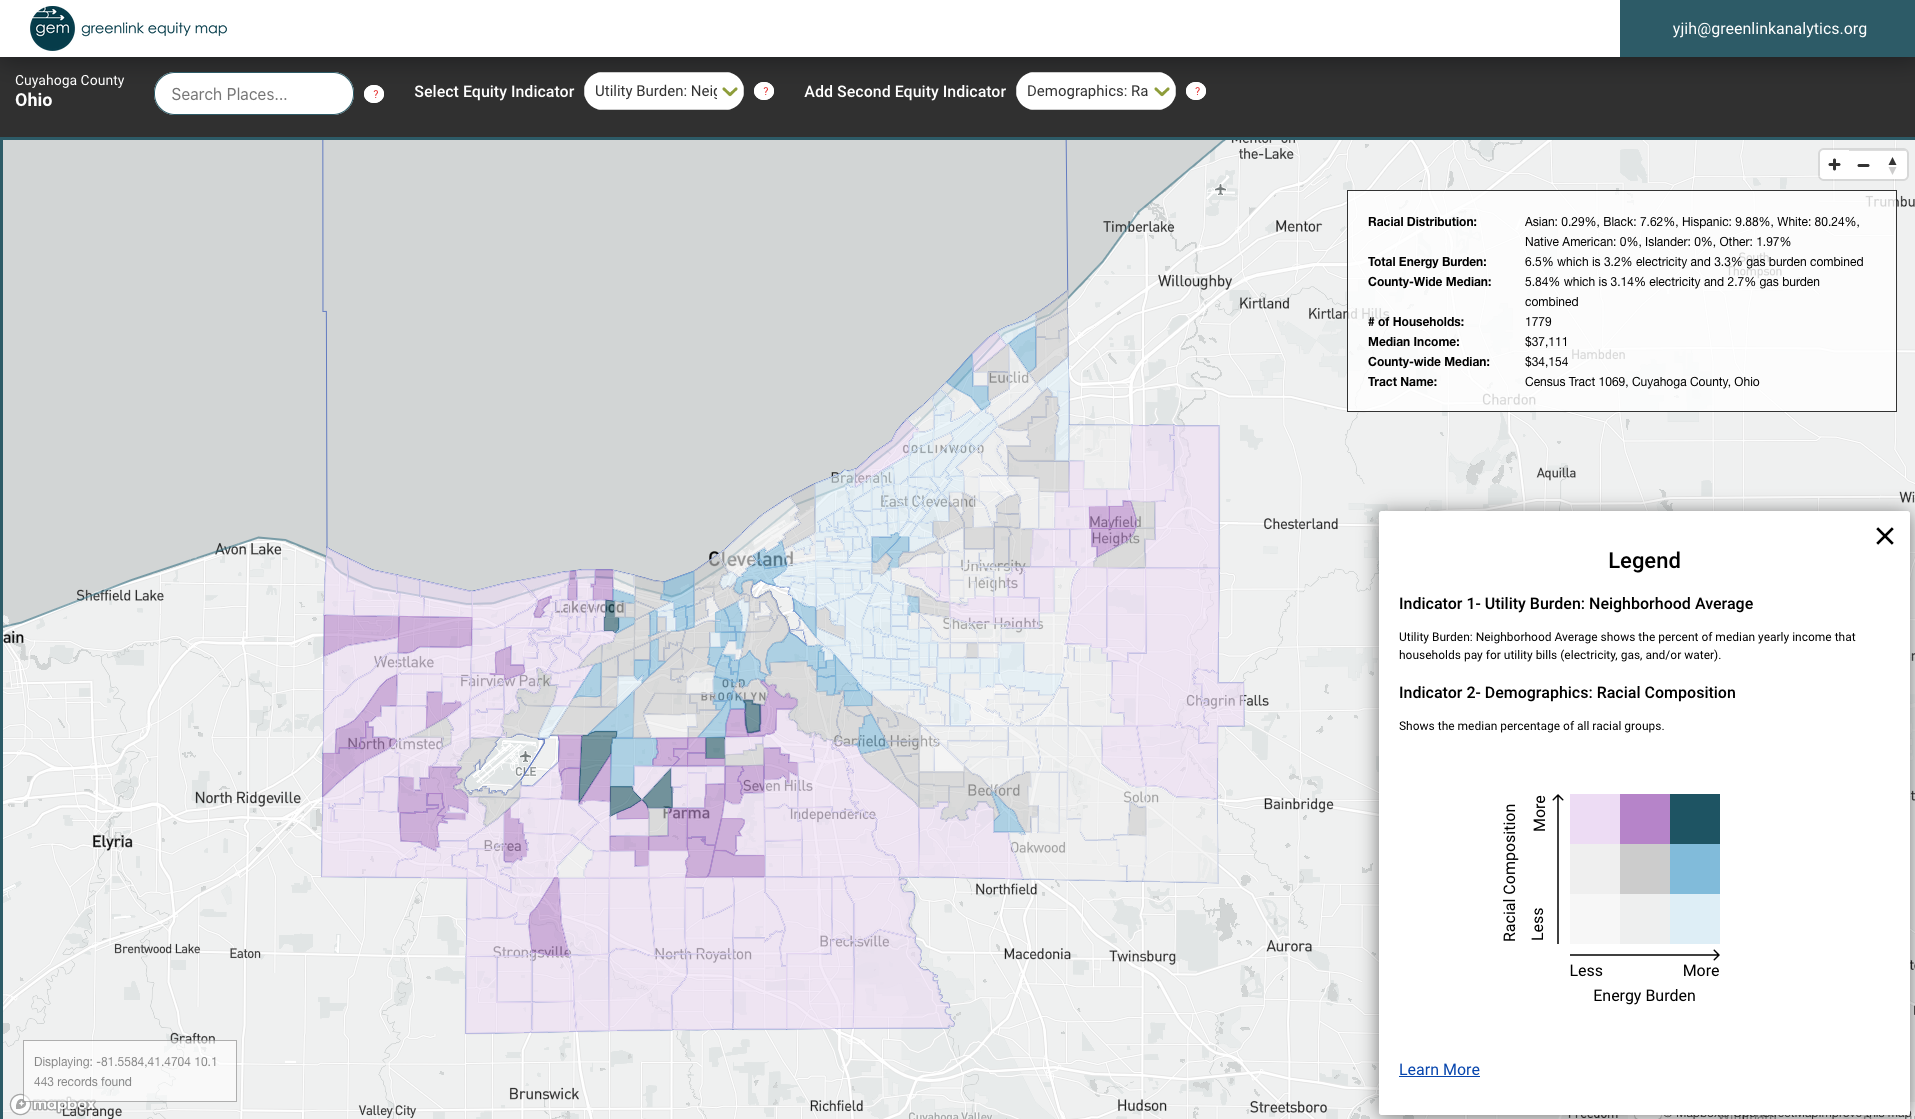
Jih was so impressed by how the data changed her city’s planning process that she wanted to facilitate similar epiphanies elsewhere. Today, she leads Greenlink’s equity-mapping efforts, working with cities all over the U.S. to craft clean energy strategies that go beyond maximizing carbon savings to prioritize the needs of the people living there. In Cleveland, for example, a community organization launched a tree-planting program to help cool down neighborhoods suffering from high heat — and high energy bills — in the summer.
We spoke with Jih, a 2021 Grist 50 honoree, about how data can unify local governments, residents, and advocacy groups as they work toward a common goal of clean, green, and just cities. Her responses have been edited for length and clarity.
Q. How can data shape the cities of the future?
A. A lot of the time, we hear decision-makers say the people who complain the most get the most resources. The squeaky wheel gets the grease. What data can do is uplift the lived experiences of people and give voices to the folks who can’t make it to every city council meeting. It gives people a baseline to start working from by answering things like, What are people’s incomes? What are the racial demographics? Where are the highest energy burdens? The data can highlight disparities — where there are areas with great need, or where there is good work happening that we need to continue and model across the city.
Having said that, we must be sure that we’re “ground-truthing” data and making sure it matches the lived experiences of community members. That cannot be overlooked. I once had a resident talk to me about the energy-burden map for her city and how it didn’t quite match up with where she believed the greatest areas of need were. It turned out that NGOs had done a lot of work to teach people in certain communities about energy efficiency. Even though those areas were super low-income and in theory should have had much higher energy burdens, they didn’t. But just because they were using less electricity didn’t mean they weren’t in need of help. If you keep the AC super low in the summers or the heat very low in the winters, that can have run-on health impacts. That kind of thing wouldn’t be captured on our maps.
Data is important — but lived experience and community engagement are just as important.
Help us imagine the sustainable cities of the future. We want to hear what you’re seeing today that’s exciting, or your biggest ideas for the future.
Q. Tell me more about the maps. What do those show, and how?
A. I am so, so incredibly excited about this: Last year, we got a grant from the Kresge Foundation and Bloomberg Philanthropies to create energy-equity maps for 50 cities across the United States. The Greenlink Equity Map (GEM) shows over 20 equity indicators at a neighborhood level, based on data from public and private sources. People can look at utility burden, income, race, health indicators like asthma rates and healthcare access, access to the internet — which has become even more important due to COVID — and see, in a very visual way, what the disparities look like across their city. They can download the data; they can layer two indicators on top of each other to see the overlaps.
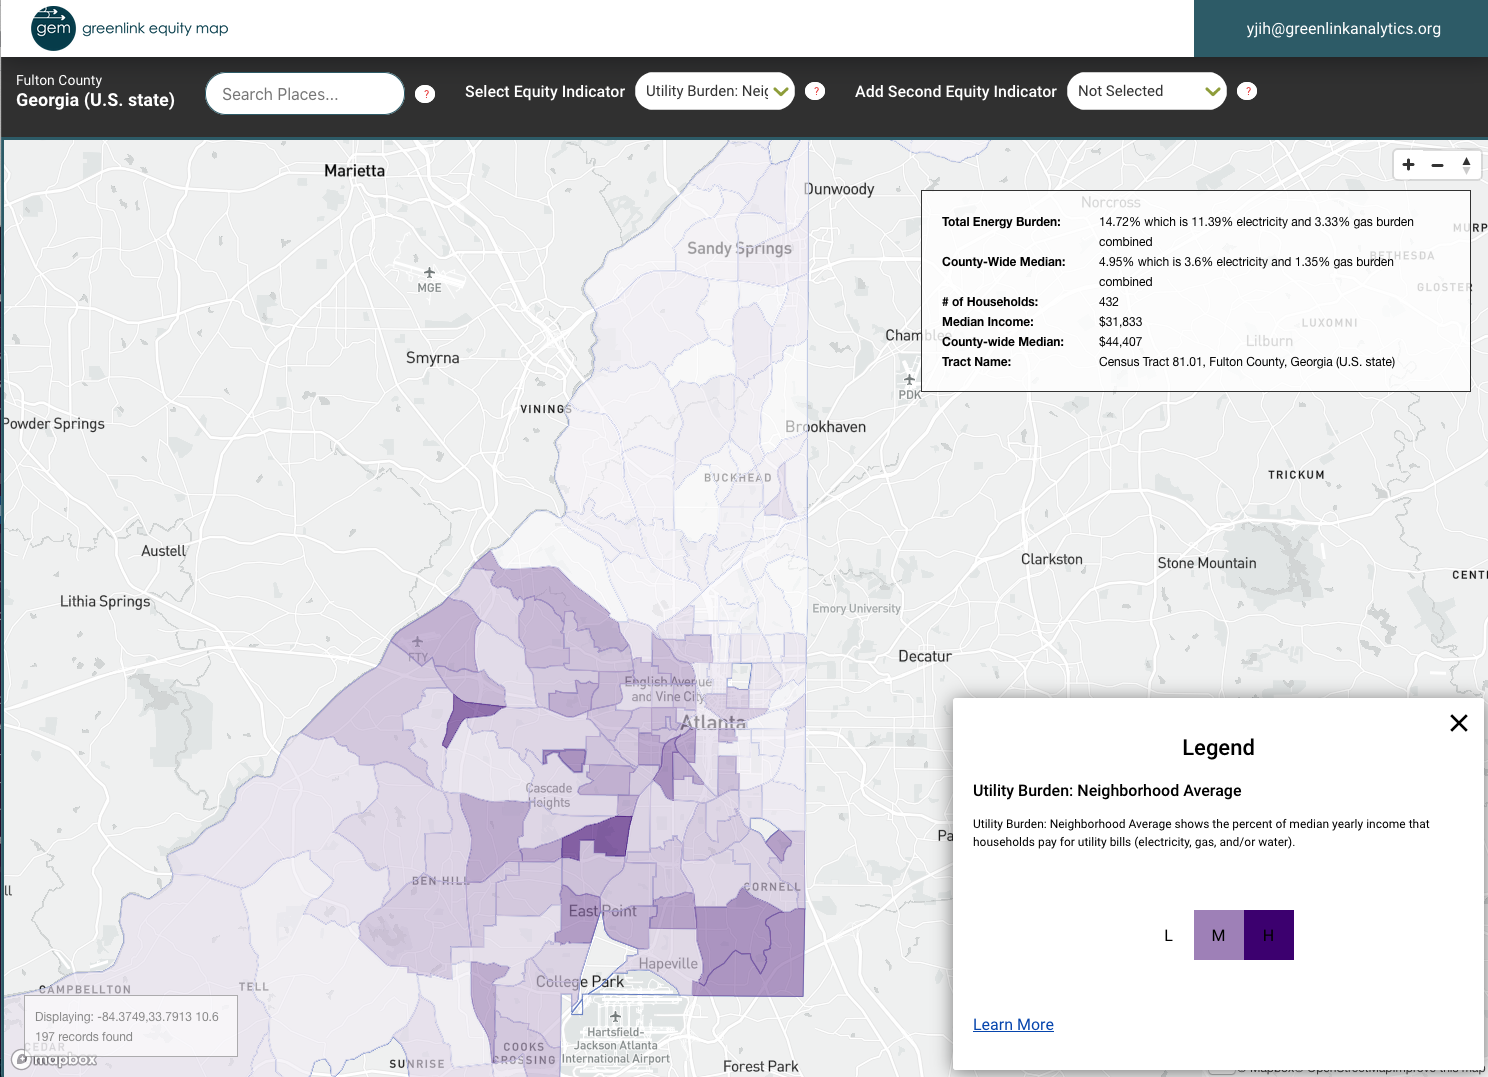
In Atlanta, for instance, if you look at where there are predominantly white populations and high energy burden, you won’t see much. But if you look at Latino or Black communities, you’ll see concentrations of high energy burden. It really reinforces the need for conversations around racial justice and energy justice in the community.
Q. Who can access the data?
A. The grant let us build this platform for city staff members, but we got a second grant in October to open it up to community-based organizations. In those 50 cities, we’re taking applications for orgs to access the platform. They can use this data to be better advocates in their cities, with their utilities, at their state legislatures.
With our partners at Upright Consulting Services in Portland, Oregon, we’re creating a community of practice for city folks and community-based organizations to come together monthly. They can share best practices, talk about what they’re learning from their maps, and talk to us about whether the maps make sense and how they’re using them to create better climate policies and programs. This is all informed by our process guide for GEM, which focuses on how cities and communities can work together, using data to set the table for these conversations.

Q. What are some of the coolest ways you’ve seen cities use Greenlink’s data and equity maps?
A. Cleveland is using this in a couple cool ways. They just did their 100 percent clean energy planning; they used the mapping to help inform community engagement areas and actually used energy burden and equity as metrics in the plan, which we helped write. They’re measuring different plans and policies on an equity metric, asking, “Is this approach going to improve or hurt energy burden and other equity factors?”
Cleveland Neighborhood Progress, an organization that partnered in the planning, is doing a really cool project with tree planting. They’re looking for areas that suffer the most from the urban heat island effect, which also tend to be lower-income areas. They’re looking at the intersection of urban heat island, low tree coverage, and high energy burden, and then, in partnership with residents and other organizations, planting trees specifically in those areas with the hope that the tree cover will decrease energy burdens. Adding more shade and greenery is one way to help address extreme heat and potentially save people money on their AC bills.
Energy burden is one of the main reasons we created GEM, but we’re seeing cities use the tool in other interesting ways. There are many ways of cutting and looking at the data. We have people on the platform looking at race and evictions, and asthma and internet access. There are some really interesting applications of this that we didn’t necessarily predict going into it.

Q. What’s your vision for the clean, green, just cities of tomorrow?
A. I want to see integrated planning. Cities need to un-silo specific departments and take responsibility for looking holistically at communities, building relationships with community members, and recognizing the knowledge and expertise that they bring. I want to see collaborative processes that give residents more power, voice, and resources to engage in decision-making.
A lot of community members who are engaging right now are doing it as volunteers, while they’re working jobs and taking care of families. They want to be involved, but it’s incredibly difficult. They might be giving the same feedback to five different departments, and very little of that information is getting integrated across city efforts.
When I worked for the city of Atlanta, we tried incredibly hard to engage community members. It is a challenging process on both sides — not many cities have the staff or facilitation capacity to be engaging with the community all the time. I understand those limitations, having been in it. But I think you get the best policies and programs when you do that well, because the people on the ground are the people with the greatest knowledge and solutions. We need to be tapping them better and giving them more leadership. That’s what I’m aiming for, and what Greenlink and Upright are aiming to do with our process guide and our community of practice. We want to shift power dynamics and give communities more voice in the planning of their own neighborhoods.
Explore more in our series on Sustainable Cities of the Future:
>> These 5 people are building the green cities of the future
>> An AI plots to take over a community’s solar power in this short story
>> What big cities can learn about climate adaptation from rural Louisiana
>> Opinion: Biden’s big conservation plan must include cities
>> The pandemic changed our cities. VR could revolutionize them.
>> What big ideas do you have for the future of cities? Share your thoughts here,