NCDC/NOAAClick to embiggen.
Much of America is about to be overrun by another miserable cold-dozer next week, but on the planetary scale, things have actually been warm. January’s temperatures were the hottest for the month since 2007 and, with a combined global average of 54.8 degrees F, this was the fourth warmest January since records began in 1880.
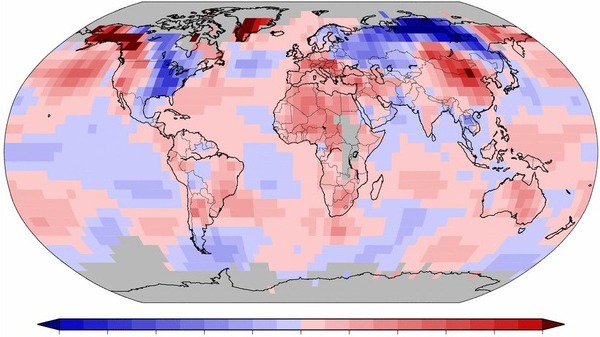
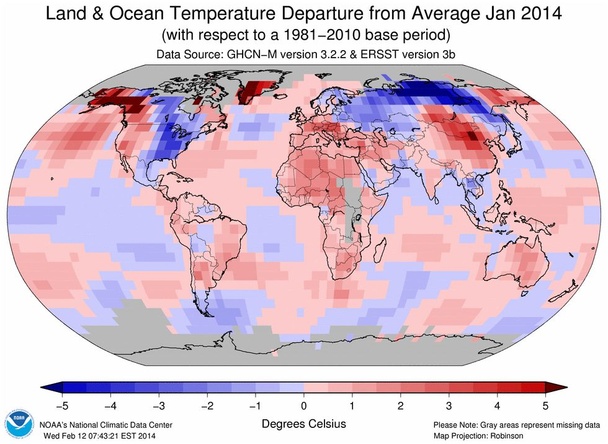
That’s the word from NOAA’s National Climatic Data Center, which recently released an updated “State of the Climate” that includes the above map of temperature anomalies. Note cooler-than-normal patches in the eastern U.S., central Canada, Scandinavia, and a big hunk of Russia, which had country-scale temperatures 9 degrees F below average. But the big story was heat, heat, heat, as NCDC explains:
During January 2014, most of the world’s land areas experienced warmer-than-average temperatures, with the most notable departures from the 1981–2010 average across Alaska, western Canada, Greenland, Mongolia, southern Russia, and northern China, where the departure from average was +3°C (+5.4°F) or greater. Meanwhile, parts of southeastern Brazil and central and southern Africa experienced record warmth with temperature departures between 0.5°C to 1.5°C above the 1981–2010 average, contributing to the highest January Southern Hemisphere land temperature departure on record at 1.13°C (2.03°F) above the 20th century average. This was also the warmest month for the Southern Hemisphere land since September 2013 when temperatures were 1.23°C (2.21°F) above the 20th century average.
Some other outliers: France tied its warmest January on record with 1988 and 1936; China logged its second-warmest January since it started collecting records in 1961; and in Spain, it was the third-hottest month since 1996.
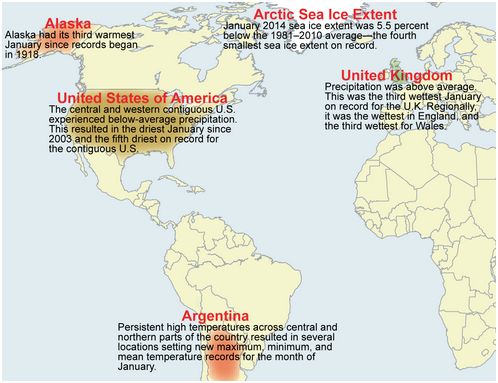
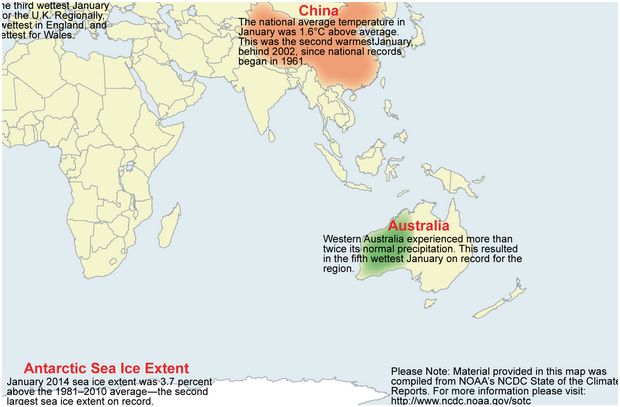
The climatologists also highlighted a few “significant climate anomalies and events” for January and pinned them to this map. Parts of the U.S. had a severe lack of rainfall, the U.K. squelched through its third-wettest January on the books, and the Arctic sea ice continues to pull a disappearing act:
NCDC / NOAAClick to embiggen.
Western Australia doubled its usual precipitation and the extent of the Antarctic sea ice got huge in a season when it historically shrinks. Why’s that last thing worrisome? “We suspect that the increasing presence of icebergs broken off from ice shelves and glaciers within the Antarctic sea ice pack is a major contributor to a temporary but increasing trend in the Antarctic sea ice extent,” explains NOAA. “Since the rapid disappearance of the Antarctic ice shelves and glaciers itself is seen as a response to global warming, the slight increase in sea ice extent that we are observing can be paradoxically linked to the same warming trend.”
NCDC / NOAAClick to embiggen.
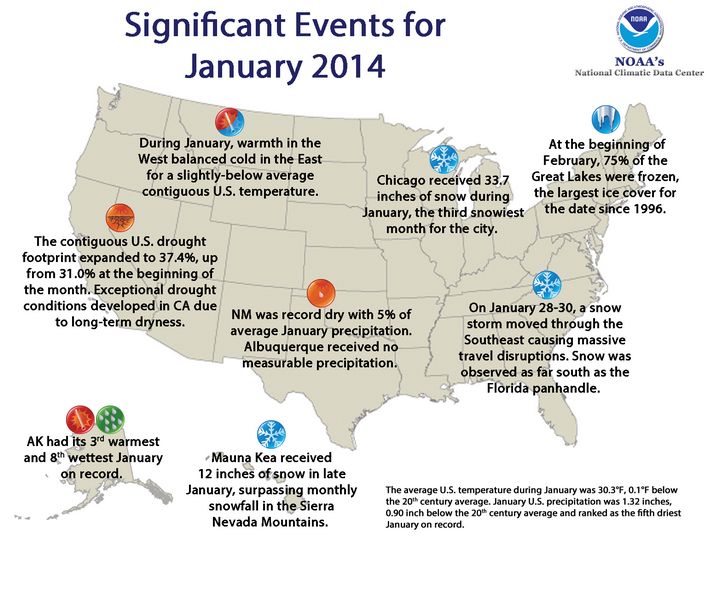
To zoom in on the climate events in the U.S., there’s this map showing California’s ingrained drought, piles and piles of snow in Chicago, and the sweaty results of Alaska’s recent heat wave. Overall, the country’s western heat lost to the eastern frigidness — temperatures were 0.1 degrees F below the 20th-century average and many states had top-10 cold Januaries, including Georgia, Alabama, Indiana, and Michigan:
NCDC / NOAAClick to embiggen.
 This story first appeared on Atlantic Cities as part of the Climate Desk collaboration.

