If you’re in one of the larger solar markets in the country (California, New Jersey, etc) then “going solar” doesn’t mean going it alone. You can likely get a “zero money down” lease or some similar financing tool to reduce the upfront cost. But is it worthwhile? The following analysis, done for a friend in Ithaca, NY, provides some context.
Solar Economics in Ithaca, NY
Comparing solar ownership to a solar lease can be tricky. The following analysis examines the value of owning a 5 kW solar PV system which can be used for comparison to a quote from a solar leasing company. Overall, long-term solar ownership can be very profitable.
The comparison can be done in two ways. The first examines the cash flow of two options for paying for your own solar array: with all cash upfront or with a bank loan at 5% interest. If you pay cash, you’ll be making money from day one, including all forecast maintenance costs. If paying off debt, it will cost extra until the loan can be paid off in approximately 5 years.
We’re not taking into account what are called the “opportunity costs” of the investment, that is, the return it could earn if put into other types of investments. Consumers rarely do this type of analysis, although businesses often do. We are also not including any tax deduction for the interest paid if the solar array were financed with a home equity loan.
The second common way to evaluate an investment is to examine its return. This can be used to compare it to other investments, like treasury securities, mutual funds, or stocks. As we can see, the cash investment has a good return over 15 years, and both solar financing options provide a good return over 25 years.
Financial Measures of Project Value
| Finance Type | Years to Payback | 15-year ROI | 25-year ROI | Profit/Loss at 15 years | Profit/Loss at 25 years |
| Cash | 10 | 9% | 12.50% | $5,000 | $16,050 |
| Debt (80% of total cost) | 18 | n/a | 7.50% | ($2,400) | $8,650 |
Neither of these analyses take into account the increased appreciation of the home because of having a solar array. A number of studies indicate that when selling the home one would get back a significant percentage of the installation value.
Comparison to Solar Leasing
Solar leasing offers several benefits over ownership, but also some potential liabilities. Benefits include no maintenance (yearly cleaning, potential inverter replacement, etc) and little to no upfront investment. But a solar lease should be examined closely and its assumptions compared to those in this analysis:
- Projected Savings: How do projected savings compare to ownership?
- Inflation Assumptions: A lease typically has two inflation rates, one for the lease payment (fixed) and one for the grid electricity price (a guess). If the latter ends up being lower than forecast (I’ve seen them as high as 5%!), it can significantly reduce projected savings.
- Lease End: What happens when the lease expires? Can the system be purchased? How does the purchase price compare to the projected savings to that point? This is very important because of the potential value of the solar array to the resale price of the home. Also one can inquire whether an inverter replacement already been done when the system is available for purchase.
- Company History: Will the company be around in 10-15 years to fulfill their lease requirements?
In summary, comparing ownership to leasing isn’t easy, but this guide can help by comparing the economics and challenging the assumptions of the lease agreement.
Assumptions for the Economics of Solar Ownership
Upfront Costs
Installed cost: $25,000
Combined incentives: $20,000
Total cost: $5,000
Ongoing Balance Sheet
Maintenance: $250 per year (including inverter replacement every 10-15 years)
Electricity savings: $838 in first year
Finance costs (if applicable): $2,600 per year for 10 years
Inflation, Financing, and Incentives
Estimated solar output: 5,776 kilowatt-hour per year for a 5 kW (DC) system
Estimated installed cost: $25,000 ($5 per Watt)
Federal incentive: 30% tax credit ($7,500)
State incentives: 25% tax credit on installed cost, up to $5,000; NYSERDA rebate of $1.50 per Watt ($7,500)
Electricity price inflation: 3% per year, starting at 14.5¢ per kilowatt-hour
Panel output decrease: 0.5% per year
Borrowing costs: 5% interest on 10-year, $20,000 loan. Largely paid back in year 2 with incentives.
Sensitivity Analysis
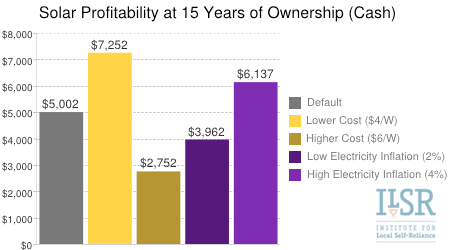
What happens if our assumptions are wrong? The following table compares the 15-year profitability of a PV system paid for with cash under different scenarios.


