The housing crisis was, of course, primarily about housing: housing that people couldn’t afford, housing that banks helped them finance anyway, housing that too many treated as a sure-fire investment.
But in a less noticed way, the housing crisis was also very much about transportation. The money we spend getting around is largely dictated by the choices we make in where to live. Buy a house 20 miles down the highway from your job, and your costs of getting around on $4-a-gallon gas are much steeper than they would be if you lived a short walk from the office (or the bus stop).
Those costs — half a tank of gas here, a bus ticket there — are much harder to track than a single monthly housing payment. They’re practically invisible. That $2,000 a month mortgage on a spacious suburban colonial? It may also cost you $100 a week in gas money. Which is just the kind of unanticipated financial burden that can break a family budget.
So how do you make the intertwined costs and tradeoffs of housing and transportation more obvious? The Center for Neighborhood Technology in Chicago has been trying to do this for several years with its Housing + Transportation Affordability Index. And, as we’ve previously mentioned, the federal government has been paying attention.
Now the U.S. Department of Housing and Urban Development and the Department of Transportation have come out with their own modified version of the tool, with CNT’s help.
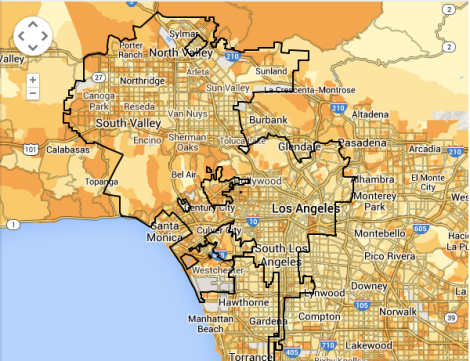
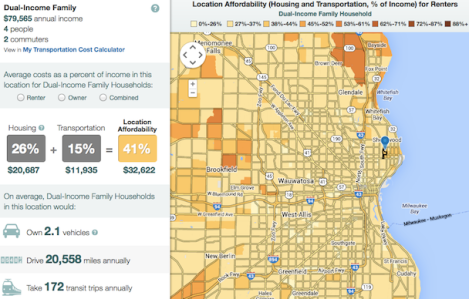
The government’s Location Affordability Index is based on data from the American Community Survey and Consumer Expenditure Surveys. Most people in the U.S. (some small parts of the country aren’t yet covered by the data) can now look up and compare the typical combined costs of housing and transportation for a range of different household types, down to the block group level. Local policymakers might also use the site to decide whether to rezone a parcel of land or where to construct a new subway stop.
HUD Secretary Shaun Donovan and his new DOT counterpart Anthony Foxx were careful to stress Tuesday that the tool is meant as an informational aid for these families and communities, not as a federal policy lever. But the site itself opens the door to that possibility in the future. Picture, for instance, the federal government using this more sophisticated calculation of what’s truly “affordable” to decide how to direct grant money, or where to build public housing, or whether to back mortgages that appear too costly (or not costly enough) when you don’t consider transportation.
For decades, the federal government has used the Interstate Highway System and the home mortgage interest deduction to encourage Americans to move out of inner cities and into their own suburban homes. A federal government that values “location efficiency” might begin to do the opposite, throwing its weight behind development that connects people to transit and jobs instead of back yards and highways.
That is, again, in the future (if it ever happens). But look carefully at what Donovan said about our recent past:
I would argue that had we had a tool like this going into the housing crisis and the bubble that we experienced — I certainly wouldn’t have argued it would have solved that problem — but I think it could have helped ameliorate some of the worst effects that we saw. Because, frankly, too often we saw individual families buying homes they thought they could afford without factoring in transportation costs.
That’s a pretty bold statement for the head of HUD, pinning at least some of the blame for the country’s housing meltdown on what is, in effect, one cost of sprawl.
Donovan said 75 to 85 percent of a family’s living costs can be explained by location. Behavior accounts for the rest. If that’s true, it would be a powerful insight for federal policy to leverage in trying to expand access to affordable communities.
“But we want to make sure that that’s in fact true now that the model is out there,” Donovan said. The government doesn’t want to end up, he says, “misunderstanding the power of this information.”
 This story was produced by Atlantic Cities as part of the Climate Desk collaboration.


