This story was originally published by Wired and is reproduced here as part of the Climate Desk collaboration.
When the U.S. Embassy in Beijing started tweeting data from an air-quality monitor, no one could have anticipated its far-reaching consequences: It triggered profound change in China’s environmental policy, advanced air-quality science in some of the world’s most polluted cities, and prompted similar efforts in neighboring countries.
As the former Regional Strategic Advisor for USAID-Asia, I have seen first-hand that doing international development is incredibly difficult. Billions of dollars are spent annually with at best mixed results and, even with the best intentions, the money often fails to move the needle. That is why I was so inspired by the story of the U.S. Embassy’s low-cost, high-impact development project. They tapped into the transformative power of democratized data, and without even intending to, managed to achieve actual change.
Here’s how it happened.
In 2008, everyone knew Beijing was polluted, but we didn’t know how much. That year, the U.S. Embassy in Beijing installed a rooftop air-quality monitor that cost the team about as much as a nice car. The device began automatically tweeting out data every hour to inform U.S. citizens of the pollution’s severity.
03-06-2015 03:00; PM2.5; 201.0; 251; Very Unhealthy (at 24-hour exposure at this level)
— BeijingAir (@BeijingAir) March 5, 2015
For the first time in China, publicly available data focused on one of the most dangerous types of air pollutants, PM2.5 — airborne fine particles less than 2.5 microns in diameter or about the thickness of a spider web’s thread. These tiny particles are small enough to penetrate your lungs and even enter your blood stream, causing serious cardiovascular and respiratory ailments. In fact, experts have recently shown that air pollution is responsible for more deaths worldwide annually than malaria and HIV combined.
In 2010, it became official: Beijing’s air quality was deemed “crazy bad” by the Embassy when the pollution exceeded the bounds of the EPA’s air quality index. This inadvertently undiplomatic tweet reached a growing audience via third-party apps that circumvented China’s Twitter firewall. People were attracted by the reliability of the Embassy’s data, which helped them make daily decisions — whether it was safe to let their children play outside, for example.
This data often painted a bleaker picture than did the Chinese official pronouncements. Beijing residents, dissatisfied with the crudeness of China’s air quality monitoring efforts, put pressure on Chinese officials to acknowledge the scale of the problem and start taking proactive measures to tackle it.
At first, the Chinese government pushed back and pressured the Embassy to stop releasing the data, saying that “such readings were illegal.” Fortunately, the Embassy stood its ground. Eventually, the Chinese government relented and began implementing an effective monitoring system of its own. By the beginning of 2013, it had succeeded in setting up around 500 PM2.5 stations in over 70 cities. Later that year, completing its about-face, China pledged hundreds of billions of dollars for cleaning the air and began to implement pollution reduction targets for major cities (now, like the embassy data, defined in terms of PM2.5).
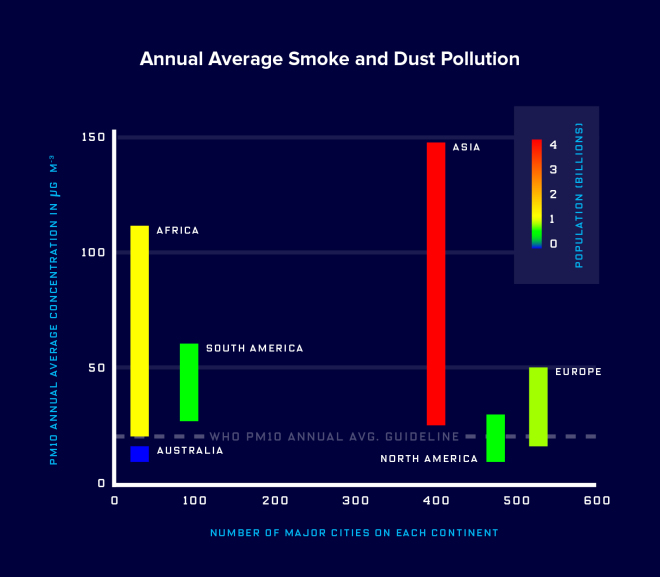
Note: The X axis should read: Number of monitored cities on each continent. The most polluted places are the least monitored. Annual average smoke and dust pollution (PM10) concentrations for each continent, as calculated from the 2014 WHO Outdoor PM Database, compared to the number of cities that had monitoring capabilities in place to report to WHO for this database. The bars indicate the standard deviation in the PM10 measurements from cities across each continent, and the color scale indicates total population of each continent.Wired
Another unintentional benefit of Embassy Beijing’s monitoring efforts, which by 2013 had expanded to four U.S. consulates in major Chinese cities, was that it provided scientists with some of the first real-time PM2.5 data. These data showed important patterns such as the fact that the worst air quality occurred at night in Beijing, whereas in Chengdu and Shenyang it came after the morning rush hour; and spring was Beijing’s least polluted time of year while summer marked the cleanest air for the other cities.
This little air-monitor-that-could also directly inspired other like-minded efforts. In India, the U.S. government has now begun tweeting data from air monitors at its embassy and consulates. In Mongolia, non-government groups in Ulaanbaatar, one of the world’s most polluted cities, ran with the Beijing example by monitoring and tweeting out air-quality data; some even saw the possibility of repurposing the concept for flood warnings. And aqicn.org, which started as a way to share U.S. Embassy — Beijing’s data, has transformed into the go-to site for hourly air-quality information at 4,000 monitoring stations stretching from Hanoi to Honolulu.
Yet, air-quality information is still severely lacking in many parts of the world, often in the most polluted regions (see figure above). The entire continent of Africa has 15 monitors that provide publicly available data on particulate matter; for comparison, there are nine such monitors in the Washington, D.C., area alone. China shows that this could change rapidly once the public is energized by accessible and easily assimilated data (though China still wrestles with openness about its air quality).
On Feb. 18th, Secretary of State John Kerry boldly transformed the Embassy Beijing model into a far larger program across numerous U.S. diplomatic missions, taking a major step forward for air-quality monitoring in some of these polluted regions and promoting data transparency around the world. Ironically, for a State Department employee, even an article as innocuous as this would be difficult to publish in one’s personal capacity. Transparency is a powerful ideal but difficult in practice; achieving it requires constant struggle — abroad, and at home.
David Roberts (no, not that David Roberts), former regional strategic adviser for USAID-Asia and science adviser to the U.S. ambassador to Japan during the post-Fukushima recovery, was active in academic physics on both sides of the Atlantic before joining the State Department.