The American Daily has just published this laughably wrong piece of disinformation by long-term global warming denier Dennis Avery, “Now CO2 is Declining as well as Temperatures.” Before AD and Avery take it down, let’s look at what passes for analysis among the deniers. The piece opens:
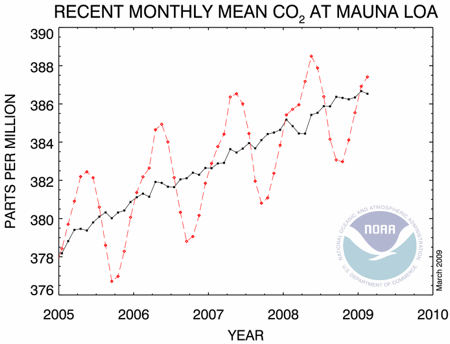
The atmospheric CO2 levels at Hawaii’s Mauna Loa observatory have declined since 2004. How can this be when humans keep emitting more greenhouse gases? Could declining atmospheric CO2 levels mean that the whole Greenhouse Warming theory is collapsing?
Now let’s look at the Mauna Loa data, something Avery didn’t bother to do (from the NOAA website here):
Doh!
Avery is an environmental economist, and a senior fellow for the Hudson Institute in Washington, D.C. I guess for conservative economists, “declined” means “steadily increased.” I guess that’s why, after eight years of being run by conservative economics, the economy is in such bad shape. [Insert your conservative economist joke here in the comments.] But I digress.
What’s especially laughable about this piece of “analysis” is that not only didn’t Avery check the Mauna Loa data, which would take maybe 10 seconds to find with Google — he apparently didn’t bother reading his original source or look at the title of his own footnote, which is “Mauna Loa Rate of Change.”
Avery’s inanity is actually based on some torturous and cherry-picked analysis from the winner of the 2008 Weblog Award for Best Anti-Science Blog, “Watts Up With That” [see “Diagnosing a victim of anti-science syndrome (ASS)“].
Watts tries to make the case that the rate of change of CO2 growth at Mauna Loa has declined and that means something (see here if you are a masochist with much free time on your hands). But Mauna Loa is only one of great many stations around the world, and CO2 concentrations are not perfectly uniform globally.
Here is the “Annual Mean Growth Rate [of CO2 concentrations] Global Average” for the last two decades of data from NOAA’s “Trends in Atmospheric Carbon Dioxide – Global” (see here halfway down the page):
1990 1.24
1991 0.82
1992 0.64
1993 1.15
1994 1.68
1995 1.98
1996 1.07
1997 1.97
1998 2.91
1999 1.36
2000 1.24
2001 1.85
2002 2.39
2003 2.21
2004 1.62
2005 2.41
2006 1.79
2007 2.16
2008 2.08
Do you see any slowing in the rate of growth of carbon dioxide emissions? [Please ignore this question if you are a conservative economist.]
In fact, since 2000, global average CO2 concentrations have risen 2.06 ppm — 40 percent higher than the rate from the previous decade. Indeed, “since 2004” — from 2005 on — they have risen 2.11 ppm, so it is awfully hard to make a case that even the rate of growth of CO2 concentrations has slowed — unless of course you are a global warming denier and/or conservative economist.
Quite the reverse — they have soared. Why? At the same time that CO2 emissions are soaring, CO2 sinks are saturating (see “The ocean is absorbing less carbon dioxide“).
Yes, once again, the actual data gives one more reason to be worried, not less. Avery ends his piece:
Scientific maxim: If you [sic!] theory doesn’t fit observed reality, change your theory.
That is indeed a scientific maxim, though it isn’t terribly relevant here. More to the point would be:
Conservative maxim: If your theory doesn’t fit observed data, misstate and cherry-pick the data until it does.
But then Avery, has been at the global warming disinformation game for a while. He co-authored Unstoppable Global Warming: Every 1,500 Years with uber-denier Fred Singer — in spite of the fact that the Earth wasn’t actually in a warm trend — unstoppable or otherwise — 1,500 years ago! (see “Unstoppable disinformation every 15 minutes from Fred Singer“).
You can’t make this stuff up — unless you are a denier, that is!
This post was created for ClimateProgress.org, a project of the Center for American Progress Action Fund.


