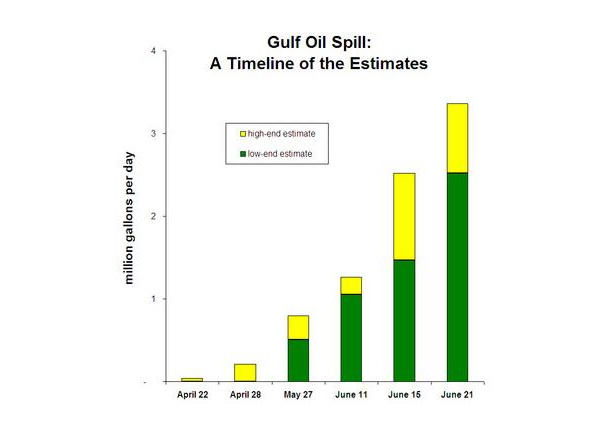
The image says it all, I think:
As has been remarked elsewhere, if the latest low-end estimate is accurate — that the leak is spewing approximately 2.5 million gallons per day — then the rupture is emitting as much oil about every 4 days as the Exxon Valdez did in total.
Here’s the timeline:
- April 20: Deepwater Horizon explodes.
- April 22: The leak is estimated at 1,000 barrels (42,000 gallons) per day.
- April 28: The estimate is increased to 5,000 barrels (210,000 gallons) per day.
- May 27: The estimate is increased to between 12,000 and 19,000 barrels (roughly 500,000 to 800,000 gallons) per day.
- June 11: The estimate is increased to between 25,000 and 30,000 barrels (roughly 1 million and 1.3 million gallons) per day.
- June 15: The estimate is increased to between 30,000 and 60,000 barrels (roughly 1.5 million and 2.5 million gallons) per day.
- June 21: The estimate is increased to between 60,000 and 80,000 barrles (roughly 2.5 and 3.4 million gallons) per day.
Notes: My version of the timeline is drawn mainly from news media accounts. There appear to be several, slightly conflicting, versions of the timeline published in various places around the web. In particular, there’s some uncertainty about when the first estimate of 42,000 gallons (1,000 barrels) per day became part of the official record. My April 22 estimate comes from the Wall Street Journal; my April 28, May 27, June 11, and June 15 estimates are from the New York Times. Estimate for June 21 is from the NYT’s Dot Earth blog, here. It suggests that the real figure is probably even higher.
This post originally appeared at Sightline’s Daily Score blog.


