The answer to the question “where the heck is global warming?” is “precisely where you would expect,” as we will see.
Wired has done some excellent reporting on one of the supposed start-dumping-your-clean-energy-stocks e-mails — the one by Kevin Trenberth, head of the Climate Analysis Section at the National Center for Atmospheric Research (NCAR) in Boulder, Colorado:
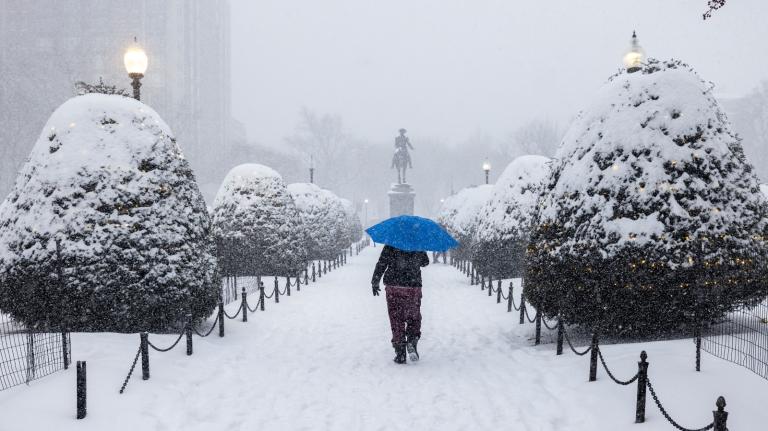
Well I have my own article on where the heck is global warming? We are asking that here in Boulder where we have broken records the past two days for the coldest days on record. We had 4 inches of snow. The high the last 2 days was below 30F and the normal is 69F, and it smashed the previous records for these days by 10F. The low was about 18F and also a record low, well below the previous record low….
The fact is that we can’t account for the lack of warming at the moment, and it is a travesty that we can’t. The CERES data published in the August BAMS 09 supplement on 2008 shows there should be even more warming: but the data are surely wrong. Our observing system is inadequate.
Note: No, I’m not thrilled with reprinting part of an illegally stolen e-mail, but this was in Wired and has been confirmed by the author and actually deals with the science.
This email allegedly “suggests that reality contradicts scientific claims about global warming,” at least to those who don’t understand and accept climate science. Not surprisingly, the author, one of the country’s leading experts on climate, disagrees. Let me first note that Trenberth signed the Must Read Bali Climate Declaration by Scientists, which opens:
The 2007 IPCC report, compiled by several hundred climate scientists, has unequivocally concluded that our climate is warming rapidly, and that we are now at least 90% certain that this is mostly due to human activities. The amount of carbon dioxide in our atmosphere now far exceeds the natural range of the past 650,000 years, and it is rising very quickly due to human activity. If this trend is not halted soon, many millions of people will be at risk from extreme events such as heat waves, drought, floods and storms, our coasts and cities will be threatened by rising sea levels, and many ecosystems, plants and animal species will be in serious danger of extinction.
One can only dream that we lived in a world where that important declaration by more than 200 of the world’s leading climate scientists would get even one half the media coverage of a bunch of stolen e-mails that do nothing whatsoever to change the scientific evidence or the urgent need for action. But I digress.
Trenberth says, “If you read all of these e-mails, you will be surprised at the integrity of these scientists. The unfortunate thing about this is that people can cherry pick and take things out of context.” Here is Trenberth explaining what his e-mail in fact meant in context:
But Trenberth, who acknowledged the e-mail is genuine, says bloggers are missing the point he’s making in the e-mail by not reading the article cited in it. That article – An Imperative for Climate Change Planning (.pdf) — actually says that global warming is continuing, despite random temperature variations that would seem to suggest otherwise.
“It says we don’t have an observing system adequate to track it, but there are all other kinds of signs aside from global mean temperatures — including melting of Arctic sea ice and rising sea levels and a lot of other indicators — that global warming is continuing,” he says.
Or, as Gavin Schmidt explains deep in the comments section of RealClimate, when asked “Is Dr Trenberth correct in his claim that we can’t explain why the planet hasn’t been warming as expected?”
[Response: It is the level of explanation that is the issue. The zero-th order explanation is that ‘natural variation’ and possible structural issues in the surface data sets are plenty large enough. But it would be good to know exactly what form that natural variation has taken and why exactly it has the impact on the global mean temperatures it has. It is this second-order explanation that Trenberth is discussing. – gavin]
I would urge people to read Trenberth’s article, which asks:
The global mean temperature in 2008 was the lowest since about 2000 (Fig. 1). Given that there is continual heating of the planet, referred to as radiative forcing, by accelerating increases of carbon dioxide (Fig. 1) and other greenhouses due to human activities, why isn’t the temperature continuing to go up? The stock answer is that natural variability plays a key role1 and there was a major La Niña event early in 2008 that led to the month of January having the lowest anomaly in global temperature since 2000. While this is true, it is an incomplete explanation. In particular, what are the physical processes? From an energy standpoint, there should be an explanation that accounts for where the radiative forcing has gone. Was it compensated for temporarily by changes in clouds or aerosols, or other changes in atmospheric circulation that allowed more radiation to escape to space? Was it because a lot of heat went into melting Arctic sea ice or parts of Greenland and Antarctica, and other glaciers? Was it because the heat was buried in the ocean and sequestered, perhaps well below the surface? Was it because the La Niña led to a change in tropical ocean currents and rearranged the configuration of ocean heat? Perhaps all of these things are going on? But surely we have an adequate system to track whether this is the case or not, don’t we?
No, we don’t know for certain what explains 2008 — but as I’ve written many times, the combination of an extended La Niña plus “the deepest solar minimum in nearly a century” plus natural climate variability offer more than enough explanation for 2008 being … still bloody warm, among the ten warmest years on record – 0.1°C warmer than the decade of the 1990s as a whole – and warmer than any year of last century beside (the El-Niño-enhanced) 1998. And if you read the article you’ll see that Trenberth goes through all of the relevant factors that contribute to natural variability.
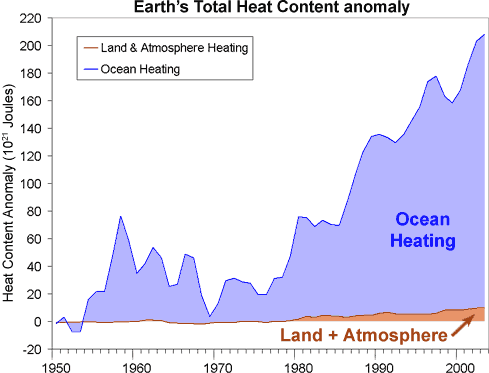
It bears repeating that a new NOAA-led study, “An observationally based energy balance for the Earth since 1950” (subs. req’d, release here) concluded:
[S]ince 1950, the planet released about 20 percent of the warming influence of heat-trapping greenhouse gases to outer space as infrared energy. Volcanic emissions lingering in the stratosphere offset about 20 percent of the heating by bounci
ng solar radiation back to space before it reached the surface. Cooling from the lower-atmosphere aerosols produced by humans balanced 50 percent of the heating. Only the remaining 10 percent of greenhouse-gas warming actually went into heating the Earth, and almost all of it went into the ocean.
That is from my post Skeptical Science explains how we know global warming is happening: It’s the oceans, stupid! The key figure:

Figure 1: “Total Earth Heat Content [anomaly] from 1950 (Murphy et al. 2009). Ocean data taken from Domingues et al 2008.”
In other words, the surface temperature data — which is subject to the vagaries of climate variability — only represent a tiny fraction of the human-caused warming. As another recent study showed, if you look at where most of the heat is going, the warming continues unabated:

Figure [2]: Time series of global mean heat storage (0–2000 m), measured in 108 Jm-2.
Where the heck is global warming? Just where you’d expect it. The study makes clear that upper ocean heat content, perhaps not surprisingly, is simply far more variable than deeper ocean heat content, and thus an imperfect indicator of the long-term warming trend.
Let me end with Trenberth’s science-based call to action, from the Bali Declaration:
Based on current scientific understanding, this requires that global greenhouse gas emissions need to be reduced by at least 50% below their 1990 levels by the year 2050. In the long run, greenhouse gas concentrations need to be stabilised at a level well below 450 ppm (parts per million; measured in CO2-equivalent concentration). In order to stay below 2ºC, global emissions must peak and decline in the next 10 to 15 years, so there is no time to lose.
No time to lose.
Related Post


