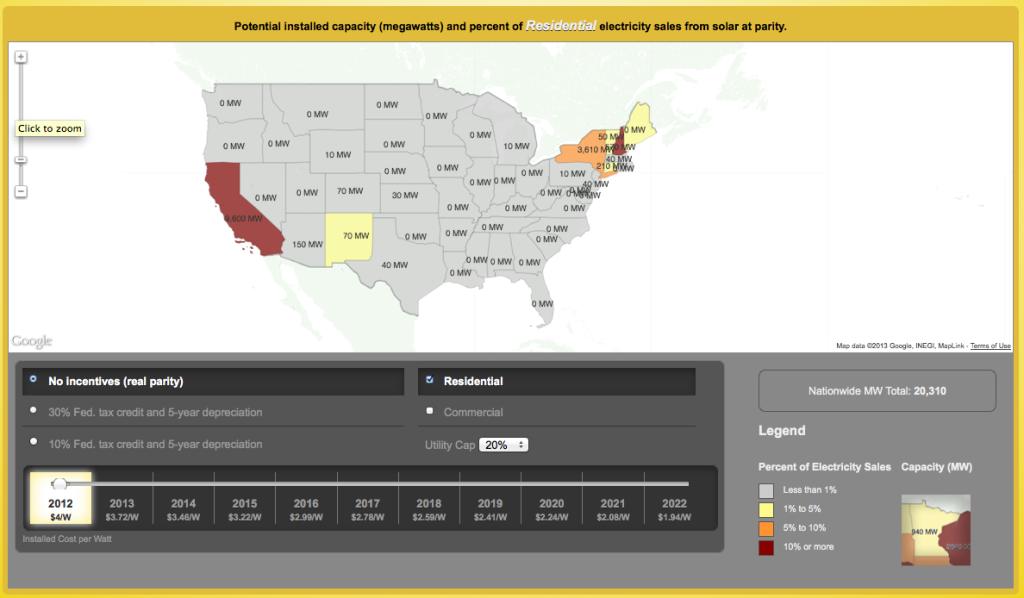
Within a decade, 300,000 megawatts of unsubsidized local solar power could compete with utility electricity prices in almost every state, enough clean energy to produce 10% of U.S. electricity. Grid parity is building like a relentless wave, but how much solar is at parity today? In 2016? In 2020? On homes or businesses? With incentives or without?
Answer all of these questions with the Greatest, Most Interactive U.S. Solar Grid Parity Map from the Institute for Local Self-Reliance. Click the link or the map image below to interact.
For more on the data behind the map, see ILSR’s Rooftop Revolution resources.
A message from
Your support keeps our climate news free.
Grist is the only award-winning newsroom focused on exploring equitable solutions to climate change. It’s vital reporting made entirely possible by loyal readers like you.
At Grist, we don’t believe in paywalls. Instead, we rely on our readers to pitch in what they can so that we can continue bringing you our solution-based climate news. Donate today to keep our site free.