The coming of solar grid parity offers an opportunity for millions of Americans to go solar affordably. But it also means a potential transformation, a democratization of an electricity system long dominated by centrally-controlled utilities and centralized ownership and production of electricity. When solar can undercut grid electricity prices, it may also undercut this 20th century system of centralized ownership, bringing economic sunshine and self-reliance to communities along with solar electricity.
This is the third of five parts of our Rooftop Revolution report being published in serial. Read Part 1 or Part 2. Download the entire report and see our other resources here.
Millions of People, Thousand of Megawatts
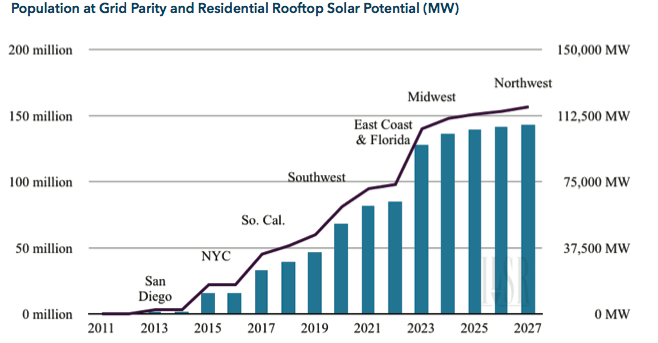
When solar grid parity arrives, it won’t mean that everyone can go solar. The most likely participants in the residential sector will be folks who own their own home. Even then, there will be some homes whose roof is unsuitable for solar power for one reason or another (e.g. shading). The following analysis takes the year of solar grid parity for the nation’s largest cities and translates it into megawatts of solar power potential.
We used the following assumptions to calculate the residential solar rooftop potential for each metropolitan area:
- Only non-vacant, owner-occupied properties were considered. Nationally, about two-thirds of homes are owner-occupied and not vacant, with major metropolitan areas varying from 50 to 70%.1
- We estimated approximately 1,000 square feet of total roof space per home.
- We assumed that only 27% of this space (in the aggregate) would be suitable for solar, based on national studies of rooftop solar potential.2
- We assumed that 1 kW of solar could be installed for every 100 s.f. of suitable roof space.
With these assumptions, we can use our previous analysis of the year of solar grid parity (based on the average residential retail electricity rate) to estimate the potential capacity of solar power that could be installed on home rooftops at grid-beating prices each year until 2027.
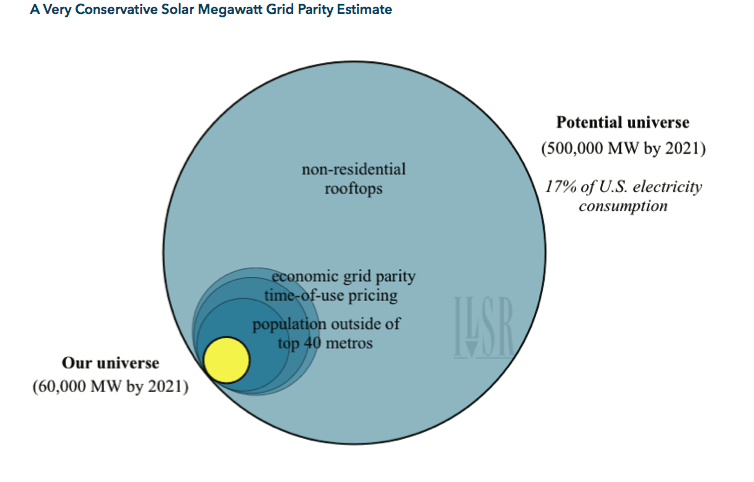
The above chart is quite conservative. For one, the data only reflect the 50% of Americans that live in the largest 40 metropolitan areas. Additionally, we used average grid prices and did not factor in time-of-use pricing or “economic grid parity.” Finally, residential solar is only a fraction of the total solar market. In California, the largest U.S. solar market, residential solar represents approximately 30% of the installed capacity in the California Solar Initiative program.3Thus, the grid parity potential numbers above are a fraction of the actual solar potential when considering commercial and public sector property as well as communities smaller than the 40 largest cities.
Additionally, rooftops aren’t the only place for solar, and the availability of other locations could further expand the grid parity opportunity. The following infographic illustrates the opportunity for solar over parking lots, near highways, and underneath existing transmission lines. It still doesn’t factor in solar placed on the ground near existing buildings.
Jobs and Economic Development
Solar provides an unparalleled economic opportunity for local power generation and local economic benefits. Each megawatt of solar power generates as many as eight jobs and $240,000 in economic activity, and most solar power projects can be built right next to or on top of the building that will use the electricity.
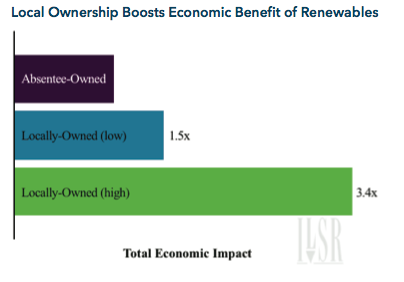
Previous studies by the National Renewable Energy Laboratory indicate that locally owned renewable energy projects multiply the job and economic benefits of renewable energy projects.
With a potential for 30,000 megawatts of residential solar in the next 6 years, communities across the country could gain over a quarter million jobs and create over $18 billion in economic activity.
Value to the Electricity System
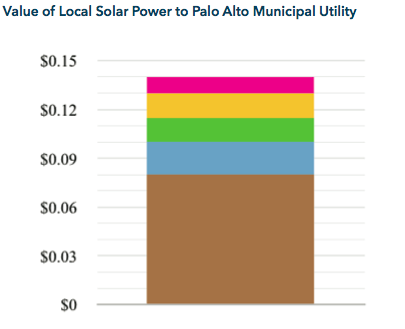
There’s also ample evidence that distributed solar power has much greater value to the grid than simply electricity output. The delivery of power during peak periods (covered by time-of-use pricing) is just one element. The ability of solar to avoid transmission access charges, supplant long-distance power sources, reduce stress on the distribution system during peak power events and hedge against fossil fuel price fluctuations can vary from $0.03 to $0.14 per kWh. Solar also has environmental benefits (relative to existing power production) that provide additional value.4
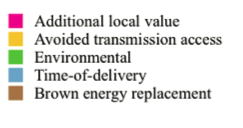
The following chart illustrates how utilities are recognizing the value of solar power, illustrating the willingness of a municipal utility to pay more for local solar power because of its various grid and local economic benefits.
Democratizing the Electricity System
Perhaps the greatest benefit of the solar grid parity opportunity will be its political impact. As millions of Americans become self-reliant energy producers, it will create an enormous constituency for continued support of distributed renewable energy development and distributed solar in particular. As an illustration, the following residential rooftop solar installation might have the capacity to produce 3 kW of electricity, but the two adults likely to live in the residence represent two solar voters.
References
- 2010 American Community Survey 1-Year Estimates. (Census Bureau, 2010). Accessed 12/8/11 at http://tinyurl.com/7ndxhg4. ↑
- Paidipati, Jay, et al. “Rooftop Photovoltaics Market Penetration Scenarios.” (Navigant Consulting, Inc., for NREL: February 2008). Accessed 8/13/08 at http://tinyurl.com/6qplow. ↑
- Applications by Sector. (California Solar Statistics, 1/10/12). Accessed 1/11/12 at http://tinyurl. com/86a7awr. ↑
- Farrell, John. Distributed Solar Power Worth Far More Than Electrons. (Institute for Local Self-Reliance Energy Self-Reliant States blog, 4/12/11). Accessed 1/13/12 at http://tinyurl.com/3tqmerh. ↑

