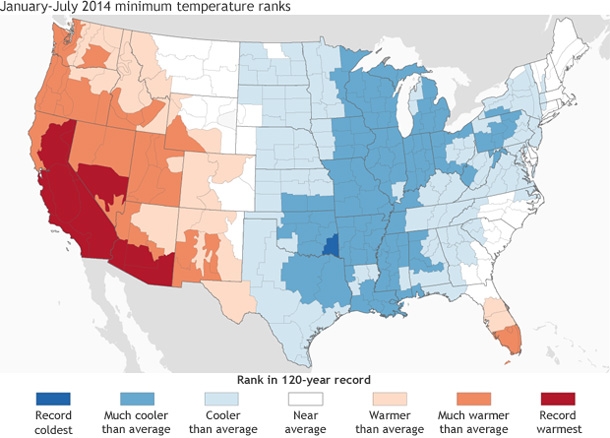
Climate.govMinimum temperature ranks for January-July 2014 within the historical record (1895-2014), from record coldest (darkest blue) to record warmest (darkest red).
This year is shaping up to be one of the weirder ones in America’s weather history. That’s because we now seem to be living in two geographically separate nations: one scalded by unbearable heat, the other bitten by waves of unusual cold.
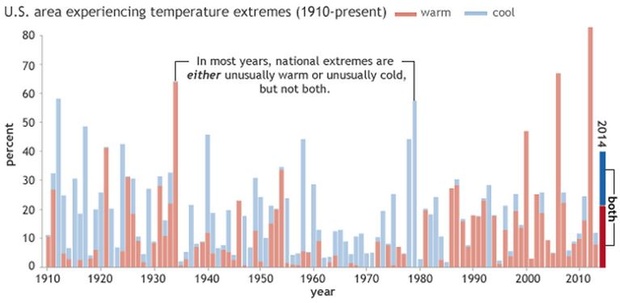
In a typical year, the U.S. has either mostly warm or mostly cool temperature extremes (meaning values at the top or bottom of a historical range of temperatures). For instance, years in the late ’70s were marked by extreme cold throughout the country, while the 2000s featured increasingly frequent baths of abnormally hot weather, as pictured in this NOAA graph of January-to-July daytime highs:
But as seen at the graph’s far right, 2014 is ushering in a prominent and record-setting split between competing regions of hot and cool temperatures — the former in the drought-plagued West and Alaska, the latter in the Midwest and Missouri Valley. Climate.gov writes:
In most years in the record, extremes are significantly lopsided: A given year’s bar is mostly red or mostly blue, sometimes capped with a small segment of the opposite color. In other words, either some part of the country is experiencing warm extremes or cold extremes, but not both. Only a handful of years have a pattern similar to 2014 — in which more than 10 percent of the country was experiencing extreme warmth while a similarly large or larger area experienced extreme coolness …
Even among these years, 2014 is unprecedented: Never before has the country experienced such large areas of simultaneous, opposing temperature extremes in the same January-July period. At a combined 40 percent of the country, the area affected by extremes so far this year is nearly double the size you’d expect due to chance.
If random weather patterns aren’t behind the great hot/cold split, what might be? The government folks behind this latest analysis promise to post possible answers soon, but one theory comes from international scientists who published a study this spring on the history of the jet stream. They believe that the stream is locked in a “positive” phase, meaning it’s hauling warmth up to the West and then blasting the East with polar chill. As the climate continues to warm, these stream-derived temperature differences could become entrenched, the scientists say, with the West experiencing more “mild, relatively warm winters” and the East increasingly winding up underneath a “freight car of arctic air.”
 This story was produced by The Atlantic’s CityLab as part of the Climate Desk collaboration.
