(Part of the How to Talk to a Climate Skeptic guide)
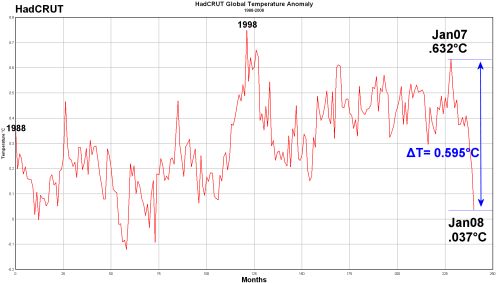
Objection: Temperatures plummeted over the last year (2007-2008). If you look at this data from the Met Office Hadley Centre you can clearly see that in one year alone global temperatures dropped .6°C, an amount equal to the entire warming over the 20th century claimed by the IPCC.
Answer:
This argument represents a fundamental misunderstanding of the difference between weather and climate. Climate is generally defined as the weather conditions averaged over a long period, usually around 30 years. One can not discern a trend in climate change by looking at small numbers of years, much less a single one. On top of that, this fallacious objection is using global temperatures in a single month, not even an entire year! An even cursory look at the graph above reveals the very noisy nature of monthly temperatures, even when averaged over the entire globe. The particular Jan. 2007 to Jan. 2008 drop used for this argument is indeed large, but it is by no means the only place you could pick to draw a steep line, either up or down. Look at the huge leap up from month 219 to month 231 or the sudden drop from month 152 to month 164 (I am only using intervals of 12 months to avoid seasonal bias). This is very noisy data and those dramatic fluctuations turned out to be just that: noise.
Discerning a trend from noisy data is one of the most basic processes in scientific research, so even though this argument has a naive appeal to the majority of us with no statistical training, you can be sure that any scientifically trained individual trying to make a case for cooling out of this graph is not being intellectually honest. Please consider any source of this argument as very unreliable, either by being very uninformed about basic scientific processes, or very dishonest, hoping to take advantage of less informed people.
So what do we see when we step back and look at the whole picture?
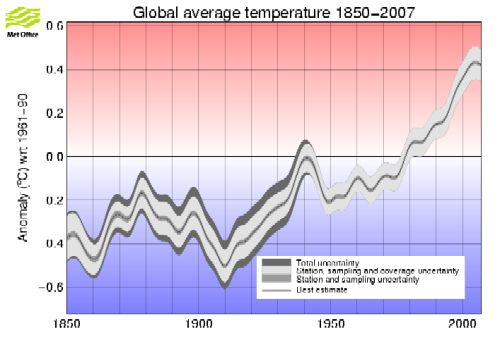
Clearly the last few years, far from erasing the entire warming of the 20th century, have remained far above the global baseline (1951-1990 average). We can also see that even in globally and seasonally averaged and smoothed data, there are still numerous peaks and troughs that are irrelevant to the long-term trends. On this graph, the last four or five years do look as though the trend has paused and even reversed but this is actually a misleading artifact of how the graph was produced. If you look at the page on the Hadley site that describes the smoothing method used, you will see that it is actually too soon to know what the real 2007 trend direction is. The smoothing they use requires 10 years of data on either side of the year in question. So though the trend today may in fact be down, we will not know this for sure until 10 years from now. Hadley Centre made the decision to continue the line until 2007 to avoid the appearance of incomplete data despite the fact that the last 10 years are less and less meaningful.
There is no convincing reason to think that the well established and attributed long-term trend has reversed nor that it is likely to for many years to come, even if effective global actions were taken today to stop emissions of greenhouse enhancing gases like CO2 and CH4 (methane). Short term influences like La Nina and volcanic interruptions may cause dips and slow downs but the elevated levels of greenhouse gases already in the air will eventually overwhelm the long-term.
And before you let anyone argue that the uncertainty about today I just described just means we need to wait 10 more years, please recall that we have done that and more already. Twenty years ago James Hansen was telling the U.S. senate that warming was real, significant, and anthropogenic (human caused) and the projections he provided have been largely borne out by what has been observed. The skeptics have already made us wait, and the three IPCC assessments that came out in the meantime have been more and more emphatic in their conclusions. The wait is over, the trend is clear and the cause is well understood.
It is a telling and egregious double standard for those voices that for the past 20 years have told us to wait and see are now claiming the trend is over based on such a small blip in the mountain of data.
This is just one of dozens of responses to common climate change denial arguments, which can all be found at How to Talk to a Climate Skeptic.
“Temperatures in 2008 have plummeted” is also posted on A Few Things Ill Considered, where additional comments can be found, and where the author, Coby Beck, is more likely to respond.
