Three million years ago, the atmosphere’s carbon-dioxide levels weren’t so different from those of today, but sea levels were dozens of meters higher. Looking that far back presents a foreboding peek into the future, as satellite records show that melting Antarctic ice sheets are on their way to bulking up this epoch’s oceans, too. The puzzle for scientists is that the climate models they create can’t seem to match what they see with their own eyes.
“Lots of people have been scratching their heads trying to figure out what is missing from our ice sheet models,” said Alex Bradley, an ice dynamics researcher at the British Antarctic Survey, part of the United Kingdom’s Natural Environment Research Council.
This week, two new papers in the journal Nature added to the growing pile of evidence that scientists’ models aren’t capturing a complete picture of Antarctica’s rapid deterioration. One study, published on Thursday, found that more than twice as much meltwater could be weighing on the surface of ice shelves, extensions of glaciers that float on the sea, than scientists previously thought. The study published on Tuesday identified a new potential tipping point: Where the land-anchored ice meets the sea, warming ice is creeping underneath, melting it from the belly up.
From above and below, Antarctica’s vault of ice, holding back almost 60 meters of potential sea level rise, seems more imperiled than ever. But neither of the dynamics detailed by these recent studies are used in climate models — potentially leading to an underestimation of how high seas might rise in coming decades.
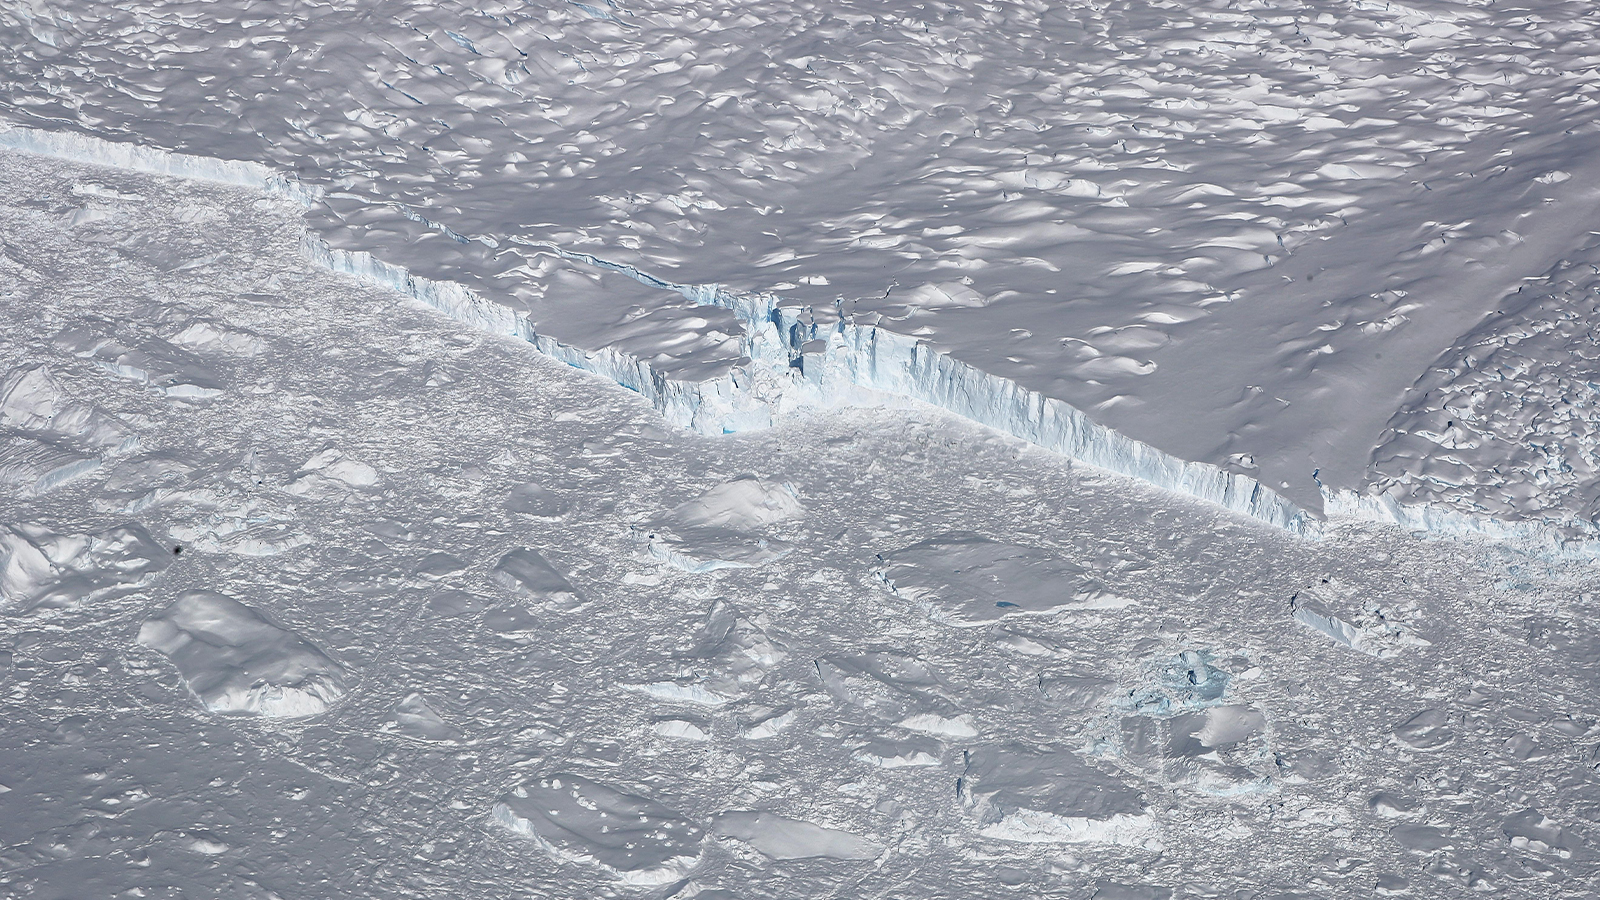
The tipping point identified by Bradley and his colleagues focuses on one of the most tender areas of the Antarctic ice sheet: the grounding line. Here, the ice flows off the land and begins to float on the sea. As the oceans become warmer, they melt a gap between the ice and the ground and push the grounding line back.
“So the ice is sliding on top of a rock that acts as a brake on the flow of the ice,” Bradley said. “And if you start to remove some of that brake, then the ice essentially flows faster.” The water erodes a cavity under the ice, which invites more water to encroach even further. And as the melting begins to penetrate kilometers beneath the ice sheet, the tipping point emerges: a self-perpetuating cycle of increasingly rapid melt.
“This process is actually much more sensitive than we understood before,” Bradley said. He thinks it might be the “missing piece” that has prevented climate models from capturing the amount of melting scientists have observed.
Melting isn’t the only way that sea water works its way under a glacier. For years, scientists have known that the pulsing of tides causes the shelf to lift up and down like a lever, pumping kilometers-long channels of water beneath the surface. While both the tides and melting warmth work in tandem against all Antarctic glaciers, some are more vulnerable to one than the other. According to Bradley, Thwaites Glacier, the so-called “Doomsday” glacier which guards the rim of the West Antarctic Ice Sheet, could be retreating more quickly due to this tidal pumping than from the melting mechanism his paper identified.
In addition to guarding the grounding line, the ice shelves attached to these glaciers act as plugs holding the ice sheet’s spillage back. But the risks to these bastions aren’t completely captured by models, either.
“When you remove that plug, it just allows all the ice that’s being held back by it to flow into the ocean faster,” said Rebecca Dell, a researcher at University of Cambridge’s Scott Polar Research Institute. “Effectively the ice flow speeds increase when the ice shelf collapses.”
One of the forces that could cause such a collapse is meltwater, which is what Dell studies. As the sun beats down on the glacial surface, the heat melts the ice into ponds. These pools weigh on the ice sheet, trickling down through cracks until the pressure of the water cleaves it open. Much of this melt — the shallow slush that hasn’t yet formed a deep pool — is harder to track by simply looking at satellite imagery; it can be mistaken for clouds or shadows.
Dell and her colleagues’ study mapped out meltwater across 57 Antarctic ice shelves by applying a machine learning method to existing satellite records that could sniff out tell-tale wavelengths of light. They found that including this slush in their models meant that at least 2.5 times more meltwater could be pooling on ice sheets than previously accounted for. And because the meltwater isn’t as white as ice, it reflects less of the sun’s energy and absorbs more of its heat — compromising ice shelves even more than scientists realized.
Though there are few key questions to answer — like how much water it takes to fracture ice — Dell said recent research, including studies like hers and Bradley’s, have brought scientists closer to being able to completely model Antarctica’s ice dynamics and remove some uncertainty from predictions of sea level rise.
“Some scientists are looking at the melting underneath the ice shelf because of the ocean, I look at it melting on top because of the atmosphere,” Dell said, who sees modeling Antarctica’s changes as a big jigsaw puzzle. “We just need to put all those components together.”