This article was first published on Clean Energy Wonk.
California’s RETI process lends insight into the near-term prospects of solar, wind, geothermal, and biomass.
In September, California’s Renewable Energy Transmission Initiative (RETI) released their Phase 2A report, which outlined potential transmission corridors to collect renewable energy from Competitive Renewable Energy Zones (CREZ) that had been identified in previous phases. As part of Phase 2A, they also screened each CREZ for environmental impact, and the potential difficulty of obtaining land for renewable energy development.
I previously looked at the results from Phase 1A and gained some insight into the cost of renewable energy technologies. However, what renewable energy projects actually get built has to do with a lot more than just economics. If it raises too many environmental concerns, such as infringing on endangered Mojave Ground Squirrel habitat, it isn’t going to get built.
Drawing on the spreadsheet “Supplemental Materials, CREZ Data” I put together the following charts, graphing the economics of each type of renewable energy in each CREZ against the expected environmental impact of that CREZ.
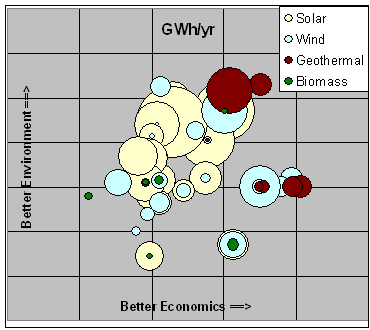
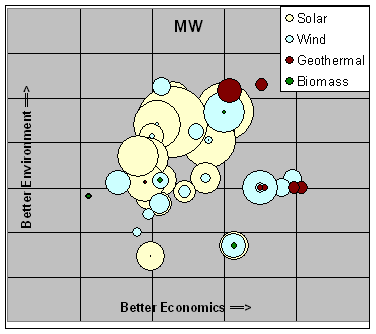
Each circle represents one type of renewable energy at one of 35 CREZs. Concentric circles in different colors appear where a single CREZ offers multiple types of renewable energy development. The only difference between the two graphs is the size of the circles. In the first graph, circle sizes represent the potential annual energy production (GWh/yr) of a CREZ, while circle sizes in the second shows power rating (MW.) Geothermal and biomass resources are relatively larger in the first graph because these are typically baseload technologies generating electricity near peak capacity all the time, while solar and wind are variable.
The cluster of circles in the middle right represent resources outside California: they were not rated for environmental concerns, so I assigned them an arbitrary value in the middle of the range in order to display them on the charts.
Economic/environmental tradeoff?
I found it surprising that there is little evidence of a tradeoff between economic viability of CREZ’s and environmental impact. In fact, the circles in the graphs above are generally clustered along a line from the lower left (high environmental impact, bad economics) to the upper right (little environmental impact, good economics). A tradeoff between economic viability and environmental concerns would manifest itself in a clustering along a line from the upper left (bad economics, little environmental impact) to the lower right (good economics, large environmental impact.)
Considering these four major renewable energy technologies, as they might be deployed in California, there is no real tradeoff between economics and the environment. The best economics coincide with the least environmental impact. If we were to include energy efficiency in the analysis, the trend would be even more pronounced: energy efficiency has the best economic profile of all, yet avoids the use of energy and hence does less harm to the environment.
The exception here is biomass. The small green dots don’t show a pronounced trend in any direction, meaning that there may be some tradeoff for biomass. Such a tradeoff would not be surprising, because harvesting plant matter on a large scale is bound to have significant ecosystem impacts. Note that biomass here does not include such technologies as waste to energy, which can be environmentally benign, or even an improvement compared to land filling. In this study, the biomass in remote regions that do not yet have transmission, since lack of sufficient transmission was one of the requirements to be a CREZ.
With clean energy, it may actually be possible to do well while doing good.