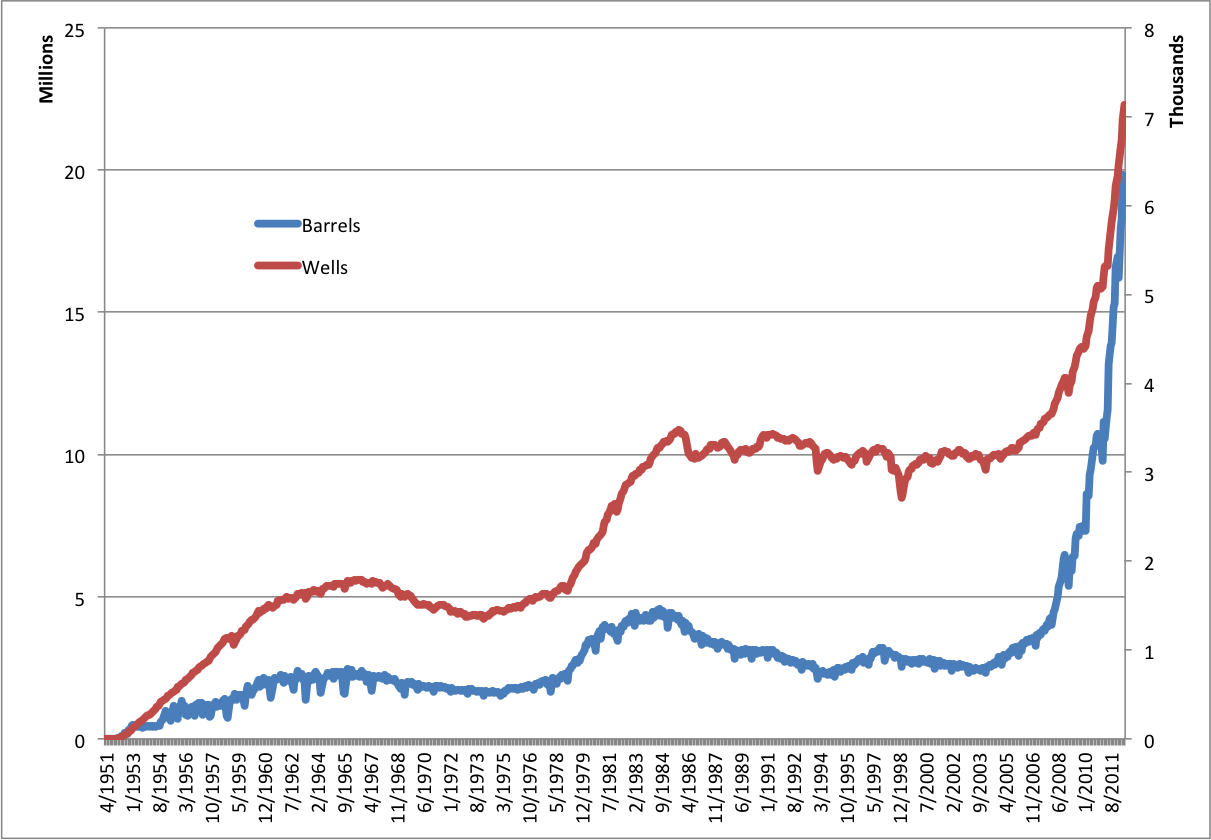
North Dakota’s Department of Mineral Resources today released the state’s monthly oil production statistics [PDF]. This is what the boom looks like, stretching back to April 1951 when the first well was built.

Barrels of oil is indicated on the left axis; number of wells, the right. Click to embiggen.
Since 2000, production has really exploded. (So to speak.) Here’s just the last 12 years.

Same scale as above. Click to embiggen.
In that second graph, the trend is clear: production has more than quadrupled in the last seven years.
Along with less pleasant impacts, the boom has meant that the state has the lowest unemployment rate in the country. Combine that with the graph above, and you get this comment made during an interview this morning, as noted by Business Insider’s Joe Weisenthal.
Mayor of Bismarck, ND, whose jobless rate is at 2.8%, and whose economy is all natural resources, says their economy is “self sustaining”
— Joseph Weisenthal (@TheStalwart) August 14, 2012
That’s probably more than a little optimistic.