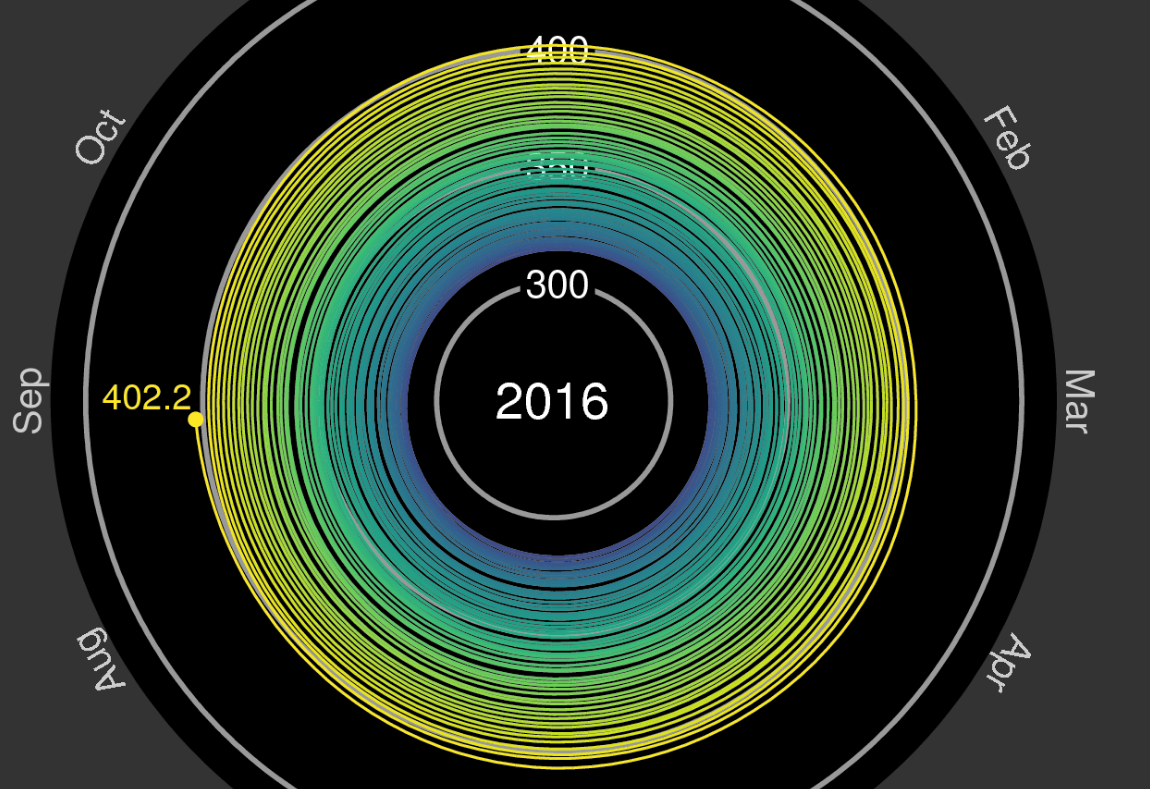
The world has blown past the 400 parts per million carbon dioxide milestone, and is unlikely to return below that threshold again in our lifetimes. It’s the biggest climate news of the week, and quite possibly, the year. And it’s also a sobering reminder of what our carbon pollution problem is doing to the world.
With that in mind, perhaps you’ve ruminated on it and stared at the Keeling Curve, trying to fathom how we got here. But if it hasn’t fully sunk in yet, please take a look at the carbon dioxide spiral below to get a grip on what our new reality looks like.
Ed Hawkins
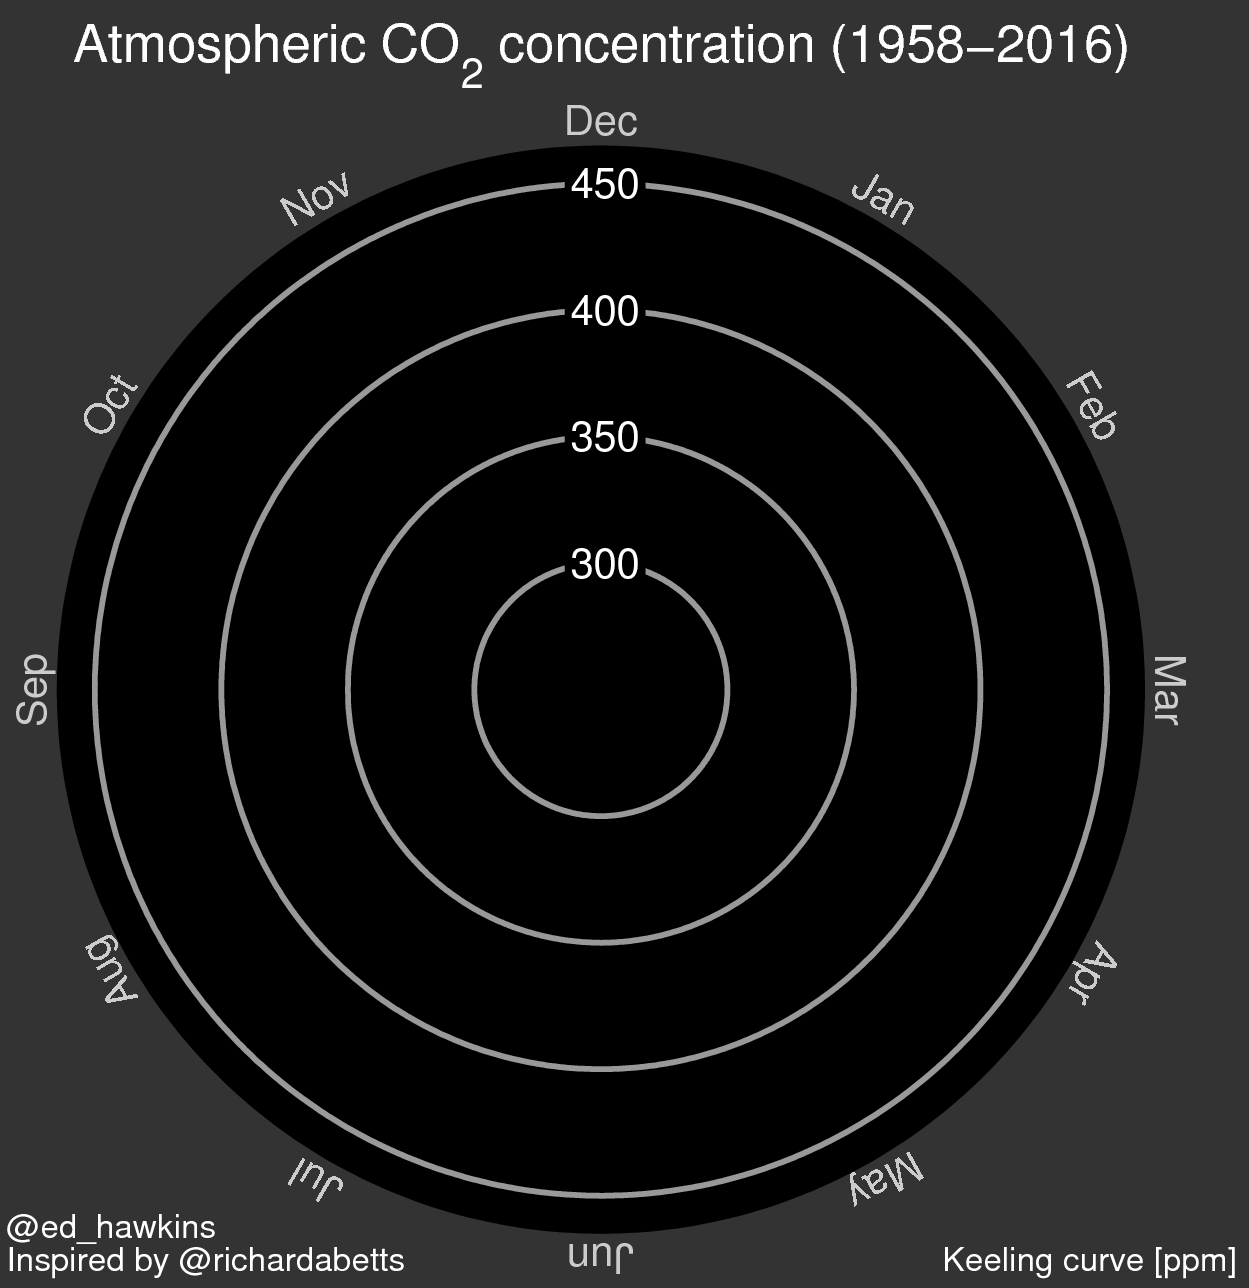
Ed Hawkins, a University of Reading climate scientist who made the temperature spiral that took the world by storm earlier this year, has done the same with carbon dioxide readings at Mauna Loa Observatory. It turns the landmark Keeling Curve into an expanding spiral of carbon dioxide. While the temperature spiral shows the effect of climate change, the carbon dioxide spiral is a reminder that human actions are at the root of it.
Mesmerizing? You bet. An apt metaphor for our fossil fuel habit? Absolutely. A kick in the pants for world leaders to do something about carbon dioxide emissions? TBD.