Cross-posted from the World Resources Institute. This piece was written by WRI Senior Associate James Bradbury for a WRI series on the EPA regulations.
The Clean Air Act (CAA) would spur energy efficiency upgrades, boosting competitiveness for many U.S. manufacturers.
Members of Congress who are committed to helping industry save energy and become more globally competitive should think twice about undercutting existing federal laws that have the potential to spur efficiency upgrades at domestic manufacturing facilities. As we await final details of new regulations designed to reduce greenhouse gas (GHG) emissions from major U.S. sources, despite criticism from industry representatives, it should be recognized that the appropriate and expected implementation of these rules will have the practical, lasting effect of achieving fuel savings and competitive advancements for affected manufacturers.
Before Congress takes any steps to limit Clean Air Act authority to reduce greenhouse gas emissions, the following considerations should be kept in mind:
- Pending CAA regulations of GHG emissions will take effect gradually, initially affecting only a small number of manufacturing facilities. Beginning in 2011, this will only require permits from new facilities or those undergoing major modifications, affecting fewer than 15 percent of all large stationary sources annually. Rules that affect existing facilities would likely not take effect until 2016 or later, giving industry and implementing state agencies ample time to prepare.
- New GHG rules would drive investment into more energy efficient technologies — leading to significant energy savings for businesses. Energy efficiency opportunities are available today for achieving up to 40 percent energy savings across a broad range of manufacturing processes. For refineries, glass, and many other manufacturers, investments in efficiency technologies would offset most if not all current environmental costs combined.
- For more than 80 percent of U.S. manufacturers, the annual cost of all current environmental controls is less than one percent of their value of product shipments. Provisions of the CAA that the EPA will use to regulate GHG emissions from industry require that they take into account the economic impact of imposing new environmental costs on each sector. Historically, regular shifts in currency exchange rates and natural gas market prices are far greater and more uncertain than environmental compliance costs, having a greater impact in international trade flows and industrial competitiveness.
The context for this debate also matters. The National Academy of Sciences recently concluded that climate change brings with it very real and growing risks to public health and the environment; it is imperative that meaningful actions to reduce GHG emissions not be delayed. CAA authority currently represents the most important tool at the government’s disposal to begin taking action to protect the climate.
How would Clean Air Act regulations of GHG emissions affect U.S. manufacturers?
Current limits on both the availability of end-of-stack control technologies (e.g., carbon capture and sequestration) and the EPA’s Clean Air Act authority mean that new regulations will most likely have the practical effect of spurring investments into energy efficiency and entail only minor impacts on U.S. manufacturers.
The first set of GHG regulations will only apply to a small set of new and significantly modified manufacturing facilities. The new permitting rules will require Best Available Control Technologies (BACT) only for new facilities and major modifications to existing plants. With the Tailoring Rule, the EPA estimates that fewer than 15 percent of all major U.S. sources of GHG emissions from the manufacturing and electricity sectors will need to address GHG emissions through the Prevention of Significant Deterioration (PSD) permitting process, annually.[1] Unless major modifications are planned, the initial set of rules — scheduled to take effect in 2011 — will not affect existing manufacturing facilities. Since commercial-scale end-of-smokestack retrofit technologies are not yet available for capturing and permanently storing carbon emissions, it is very unlikely that BACT standards will do any more than require new and modified facilities to use off-the-shelf energy efficient equipment, such as boilers, when seeking pre-construction permits.
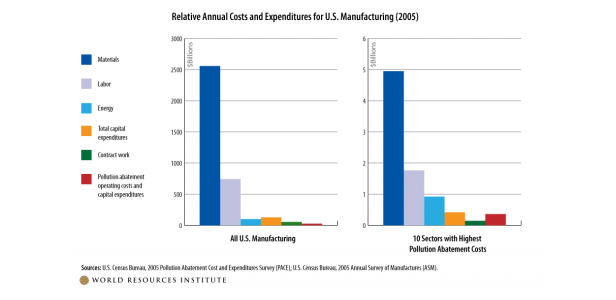
Currently, the actual costs to most U.S. manufacturers from today’s environmental regulations[2] are very low (see Figure 1), providing a good indication of the scale of the costs that the EPA might impose through future rules. The EPA regulation of existing facilities is likely to come through Section 111 (d) of the Clean Air Act (New Source Performance Standards, or NSPS), which is not likely to take effect prior to 2016. When setting standards in this way (and also when setting BACT), the EPA is required to take into account the cost of complying with such standards, including the effect that such costs would have on the economic viability of impacted sectors.
New regulations will drive significant, achievable energy efficiency upgrades
The energy efficiency upgrades that are most likely to be required by BACT are likely to significantly reduce energy costs for affected U.S. manufacturing facilities. Capital investments to increase energy productivity can improve competitiveness and create a range of other positive, cascading economic and employment effects, benefiting suppliers as well as the workers who install, operate, and maintain new equipment.
So, how much energy efficiency potential is available to U.S. industries? A host of studies,[3] have found that the use of best practices (i.e., technologies available today) could achieve up to 40 percent total energy savings across a broad range of manufacturing processes.[4] Research on this subject has generally been focused on the energy-intensive sectors that are relatively more exposed to risks from international competition[5] and volatile fossil fuel prices, which means that they also stand to benefit the most from energy efficiency investments [PDF].
To illustrate these benefits for two specific sectors:
- By upgrading to current best practices, the flat glass manufacturing and oil refining sectors could reduce their total energy usage by 28 percent [PDF] and 38 percent [PDF], respectively. For the flat glass sector, these investments would translate into a reduction in energy costs equal to 2.7 percent of the sector’s “value of product shipments” (i.e., the net selling valu
e of manufactured goods).[6] - For petroleum refineries, the result would be an energy cost reduction that is equal to 0.7 percent of the sector’s value of product shipments.[7] This finding is consistent with the outcome of stringent local environmental regulations that affected refineries in the Los Angeles Basin during the period between 1987 and 1992, leading to a sharp rise in productivity at the affected facilities at a time when productivity dropped in other U.S. regions.[8]
If energy efficiency investments are so valuable, why aren’t they more broadly adopted? Even for energy intensive manufacturers, a range of market conditions and technical barriers can prevent firms from investing in equipment upgrades that improve efficiency — like combined heat and power technologies. Emissions performance standards, like NSPS, can and should be designed to reward efficiency investments,[9] as an appropriate complement to other low-cost emissions reduction policies [PDF] (as discussed above, spurring efficiency investments is expected to be a primary objective for the EPA with respect to pending GHG regulations). Ultimately, a range of policy options may be used to increase access to financing, provide technical assistance, and establish a regulatory environment that will increase the likelihood that these capital-intensive investments in energy productivity deliver higher returns over shorter time periods.
The cost of environmental compliance and industrial competitiveness
Americans have enjoyed improved air and water quality in the decades following 1970, when Congress began enacting the major pollution control laws. During that same time period, the U.S. national GDP first doubled, and then tripled.[10] Furthermore, experience has shown that the benefits associated with clean air and water regulations have exceeded the costs [PDF]. Nevertheless, there is a perennial (though exaggerated[11]) concern that domestic environmental regulations could result in the off-shoring of jobs, less competitive manufacturing industries, and harm to the U.S. economy.[12]
What do U.S. environmental costs look like today? According to results from the most recent U.S. Census Bureau’s 2005 Pollution Abatement Costs and Expenditures (PACE) Survey, for the average U.S. manufacturing facility, total environmental costs amount to less than half of one percent of the total value of product shipments (see Figure 1). Compare this with total costs of materials, labor, and energy, each of which represent roughly 54 percent, 16 percent and two percent of the average manufacturer’s total value of product shipments, respectively.[13]
 Figure 1: Relative annual costs and expenditures for U.S. manufacturing (2005). Click for a larger version.
Even for the 10 industries with the highest total pollution abatement costs, the total cost of all such regulations averages roughly three percent of the sector’s value of product shipments, which is not insignificant but also still well below the average cost of labor (16 percent), energy (nine percent), and other major annual costs for these sectors. Figure 1 directly compares the relative significance of primary annual costs and expenditures for all manufacturing (left) versus the 10 manufacturing sectors with the highest pollution abatement costs (right). Not surprisingly, the sectors that are most pollution-intensive are typically also the most energy intensive; which means they have the most to gain by maximizing their energy productivity.
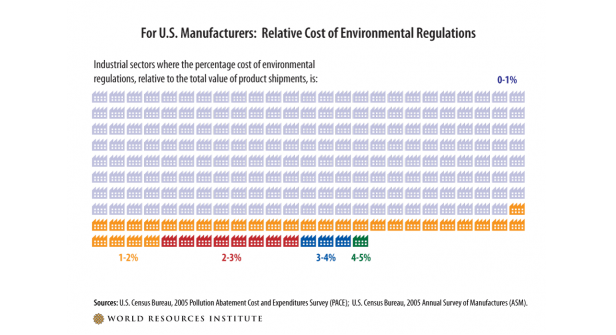
However, the 10 most heavily regulated sectors are very unusual, as illustrated by Figure 2; for more than 82 percent of surveyed sectors[14] the total cost of environmental laws is less than one percent of their total value of product shipments. With the appropriate policy instruments, it is clear (as illustrated in the previous section) that in most cases those costs could be more than offset by savings achieved through energy efficiency upgrades using technologies available today.
 Figure 2: For U.S. manufacturers, relative cost of environmental regulations. Click for a larger version.
Some factors with a much greater influence on international trade flows and the relative competitiveness of U.S. manufacturing include currency exchange rates with U.S. trading partners and natural gas prices. Historically, periodic shifts and variations in the relative value of the U.S. dollar and market prices for natural gas impose much higher costs and investment uncertainties for manufacturers than domestic environmental compliance costs, even for the most heavily regulated sectors.[15]
Conclusion: Modest costs, significant benefits
As U.S. manufacturers look for ways to cut costs without cutting jobs, protect the climate, and improve public health for workers and nearby communities, investments into energy efficiency upgrades remain a promising option. Members of Congress committed to helping industry realize these energy savings as a means for advancing the competitiveness of U.S. manufacturers should not seek to limit CAA authority that would spur efficiency investments. Instead, their focus should be on advancing legislation that will help remove technical and financial barriers to investments in these much needed facility upgrades [PDF].
The decision before Congress is made much easier when the salient facts are considered. In fact, the total cost of current environmental regulations is relatively small, proving that significant environmental and public health gains can be achieved at modest costs to affected industries and with significant net benefits to the country. Also, pending EPA regulations on GHG emissions will initially only require permits from a small minority of U.S. manufacturing facilities and require that the cost of compliance and the economic impacts of those costs be taken into account.
Ultimately, this decision is between preserving the status quo at an uncertain cost to future generations or accepting policies that will spur domestic capital investments in U.S. manufacturing, and in doing so, deliver energy savings to U.S. businesses and begin to protect the environment from dangerous warming pollution.
Endnotes:
[1] This includes only eight percent of large stationary sources that would not have otherwise been subject to PSD, absent new GHG regulations. These numbers are estimated by comparing the sum total of all large stationary sources covered by the mandatory GHG reporting rule [PDF] (i.e., 10,857 facilities with GHG emissions greater than 25,000 metric tons CO2e per year) with the EPA’s estimate [PDF] that only 1,600 PSD permitting actions will need to address GHG emissions per year; 900 of those actions will be triggered by GHG emissions alone.
[2] Throughout this piece, “environmental regulations” encompasses all mandatory federal and state rules governing clean air, clean water, and waste disposal.
[3] From the U.S. Department of Energy, this includes comprehensive reports as well as a series of energy bandwidth studies for the following sectors: pulp and paper; chemical; glass; mining; refining; and iron and steel. Reports have also been conducted by the National Academy of Sciences and by industry trade associations (e.g., a 2005 American Iron and Steel Institute report that sets an industry-wide goal to achieve a 39 percent reduction in energy-use per ton of steel production by 2025).
[4] According to the DOE energy bandwidth studies, these savings could double with greater advances in manufacturing process technology research and development.
[5] U.S. Congress, Office of Technology Assessment, Trade and Environment: Conflicts and Opportunities, OTA-BP-ITE-94 (Washington, DC: U.S. Government Printing Office, May 1992).
[6] In total, flat glass manufacturing has energy expenditures roughly equal to 16 percent of the sector’s value of product shipments and the energy bandwidth study focused on melting process technologies, which account for roughly 60 percent of the sector’s total energy use.
[7] In total, energy expenditures from petroleum refineries are roughly equal to 2.5 percent of the sector’s value of product shipments the energy bandwidth study focused on technologies that account for roughly 70 percent of total energy use.
[8] Berman, E., and L.T. Bui, 2001, Environmental Regulation and productivity: Evidence from Oil Refineries,” The Review of Economics and Statistics, 83(3), pp. 498-510.
[9] For example, output-based emissions performance standards that account for both thermal and electricity production, appropriately reward the use of more efficient combined heat and power technologies.
[10] In terms of “real” GDP, or “chained 2005 dollars.” http://www.bea.gov/national/index.htm#gdp&
[11] Goodstein, E., 1999, “The Trade-Off Myth, Fact and Fiction about Jobs and the Environment,” Island Press.
[12] U.S. Senate Committee on Environment and Public Works (2010) “EPA’s Anti-Industrial Policy: Threatening Jobs and America’s Manufacturing Base.” Minority Staff Report.
[13] Sources: U.S. Census Bureau, 2005 PACE; U.S. Census Bureau, 2005 ASM.
[14] Only considered manufacturing sectors for which 2005 data are available from both the ASM and the PACE datasets (n=241).
[15] U.S. Congress, Office of Technology Assessment, Industry, Technology, and the Environment: Competitive Challenges and Business Opportunities, OTAITE- 586 (Washington, DC: U.S. Government Printing Office, January 1994).


