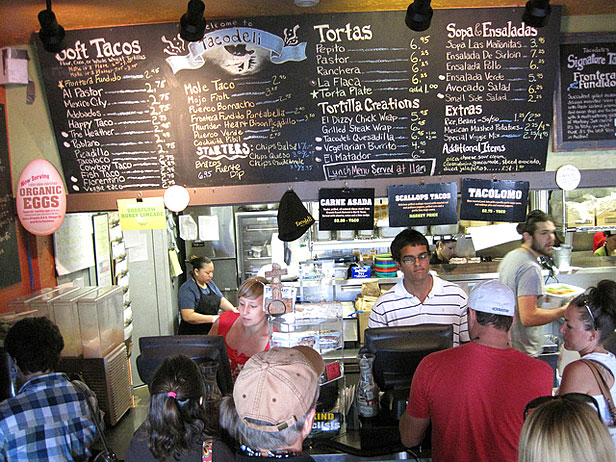
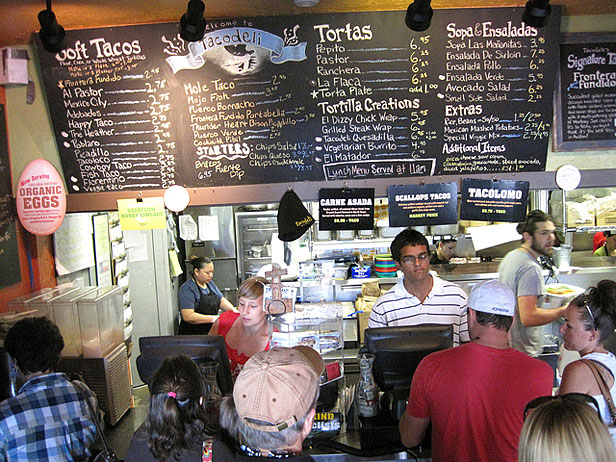
 Big-spending Austinites love their tacos. Photo courtesy Boz Bro via Flickr
Americans spend less per capita on food than any other industrialized nation — slightly less than 10 percent of our annual incomes, according to figures oft-cited by Michael Pollan and others. Of that, we spend only 5.7 percent of our incomes on food consumed at home, USDA data reports — the lowest rate of any country in the world, and that figure even includes money spent on alcohol and tobacco. That’s not because we’re cheap, exactly — it’s because U.S. food is artificially cheap, propped up by government subsidies and low-wage labor (or even slavery, as Grist’s Tom Philpott has chronicled).
But that’s the national average, and residents of U.S. cities vary widely in their spending.
The infographic below by Bundle, a project backed by Citi, Microsoft, and Morningstar that mines millions of anonymous actual financial transactions to reveal Americans’ real spending habits (compare yours!), shows that Austinites are the surprise big-spenders on food: $12,447 per year spent on groceries and eating out, versus penny-pinching Detroit residents’ $2,246. (Maybe they were all busy growing their own in the Motor City.) Believe it or not, five average Detroit households could subsist on one Austinite’s food budget. Some more tidbits:
If Manhattan were its own city, it would be No. 1 for food spending ($13,079) and No. 1 for share of food budget spent on restaurants (59 percent).
In Atlanta, dining out accounts for 57 percent percent of the city’s average total food and drink spending annually, the highest in the U.S. and 28 percent higher than the U.S. average.
Denver residents allocate 22 percent of their daily spending to food, more than any other big city in the country.
Bundle also sliced and diced the food-spending data in other interesting ways. Among the findings: “Americans spent 33 percent less on groceries in February than in December; singles’ food spending bounces up and down over the course of a year; and where we eat changes as we get older.” Unsurprisingly, it turns out that the more money we have, the more we’re willing to spend on tasty treats. But as a percentage of income the rates stayed about the same: people making $40,000 to $50,000 spent $5,560 on food in 2009, while people making more than $125,000 spent $12,655 — most likely on “better cuts of meat, more organic foods, more gourmet or prepared foods,” Hayden Stewart, an economist at the U.S. Department of Agriculture, told Bundle.
That’s a lot of money that could be flowing to support local urban-agriculture efforts, or to the nouvelle fast-food purveyors who draw from them.


