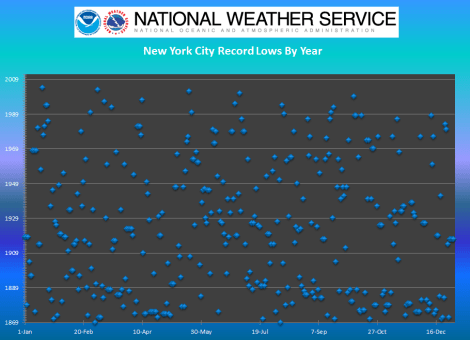
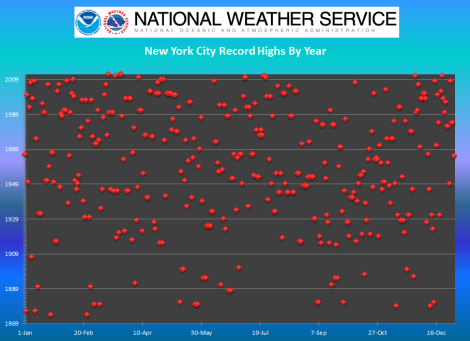
The National Oceanic and Atmospheric Administration (NOAA, an abbreviation I wish everyone knew so that I didn’t constantly have to type “National Oceanic and Atmospheric Administration”) put together two charts illustrating new high and low daily temperature records in New York City since 1869.
Here’s the low temperature records chart:
And the high:
You’ll notice that the low records chart is bottom-heavy; far more low temperature records were set closer to 1869 than to 2012. The high temperature chart is the opposite.
As NOAA notes:
The last record low set or tied at Central Park was on January 16, 2004. There have been 29 record highs set at Central Park since that date.
Literally no one anywhere knows why this might be happening.

It’s getting hot in here. (Photo by Andrew Mace.)


