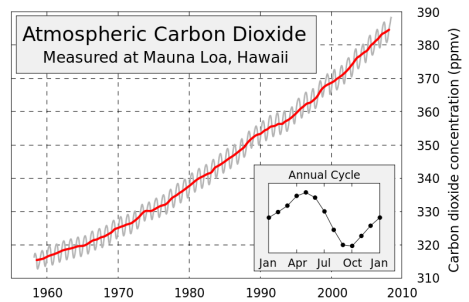
In 1958, Charles Keeling began measuring the the concentration of atmospheric carbon dioxide. Decades later, scientists at the Mauna Loa Observatory are still measuring, creating “the world’s longest unbroken record” of that data. They’re the ones responsible for the upkeep of this famous graph:
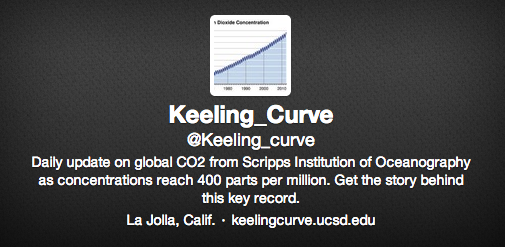
It must be kind of terrifying to track carbon concentrations on a daily basis as they tick slowly upwards. And sometimes when you’re watching something depressing, you just have to share it. So the Scripps Institution of Oceanography, which is in charge of the research, is posting the daily measurements on Twitter, so we can see the concentrations rise and fall with the seasons — while, over the course of years, getting worse and worse and worse.
Here’s yesterday’s measure for instance:
398.36 parts per million CO2 in air
— Keeling_Curve (@Keeling_curve) April 25, 2013
April 24, 2013
And, yah, that’s too high. Man, this is the most depressing Twitter account ever. I miss Shit My Dad Says.
A message from
Your support keeps our climate news free.
Grist is the only award-winning newsroom focused on exploring equitable solutions to climate change. It’s vital reporting made entirely possible by loyal readers like you.
At Grist, we don’t believe in paywalls. Instead, we rely on our readers to pitch in what they can so that we can continue bringing you our solution-based climate news. Donate today to keep our site free.