First the good news: Arctic ice melt has not been as extreme this summer as during last year’s historic collapse.
The bad news is that the melt has been more extreme this summer than the 20-year average — no surprises there, given the icy clime’s rapid decline.
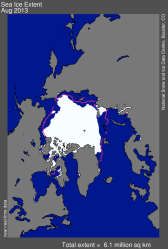
The Arctic’s August 2013 ice coverage is shown in the image on the right. The black cross shows the North Pole and the magenta outline shows the average ice cover at the same time of year from 1981 to 2010.
“Sea ice continued its late-season summer decline through August at a near-average pace,” wrote the National Snow & Ice Data Center in an update on its website last week. “Open water was observed in the ice cover close to the North Pole, while in the Antarctic, sea ice has been at a record high the past few days.” From the Alaska Dispatch:
[Ted Scambos, a glaciologist with the ice center] said the Arctic this summer was 2 to 3 degrees cooler than average, and the extent of sea ice in August was a “big increase” for a year-to-year jump. The sea ice was about the size of four Alaskas, at 2.35 million square miles, a 45 percent increase from the same time last year.
But that’s about the same size of sea-ice coverage in August 2009, which turned out to be one of the lowest years on record, Scambos said.
It was nothing close to the years before 2002. In fact, the sea-ice extent in August remained nearly 400,000 square miles less than the average between 1981 and 2010, with an amount of ice the size of Colombia in South America missing.
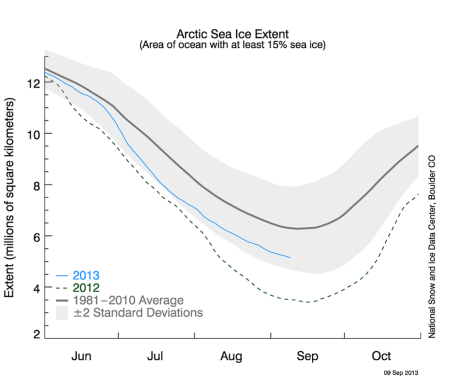
Since no news of sea-ice decline can go announced without some measure of climate-denying absurdity, let’s see what the conga-line of climate-denying ninnies led by the U.K.’s Daily Mail have to say, hmm? Naturally they point to the Arctic-melt data to argue for magical global cooling despite the skyrocketing levels of heat-trapping carbon in the atmosphere. Let’s consider that claim as we ponder the following graph, shall we?
Take your time, Daily Mail, we’ll wait.

