CP: So it’s friggin’ hot in DC and much of the country.
Audience: How hot is it?
CP: It’s so hot that:
- I saw a dog chasing a cat and they were both walkin’.
- The robins are laying their eggs sunny side up.
- I saw squirrels fanning their nuts.
- Even meteorologists are doing stories about human-caused global warming.
Settle down, anti-science disinformers who try to shout down any talk of a link between climate change and extreme weather — these are only jokes. We all know that you can’t use a single weather event as evidence for or against climate change — unless of course that weather event is a big snowstorm [see “Massive moisture-driven extreme precipitation during warmest winter in the satellite record — and the disinformers say it disproves (!) climate science].
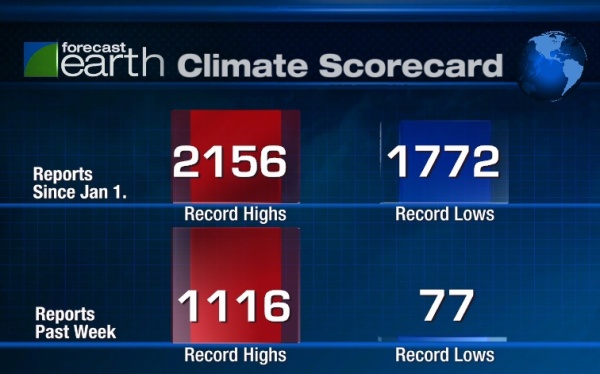
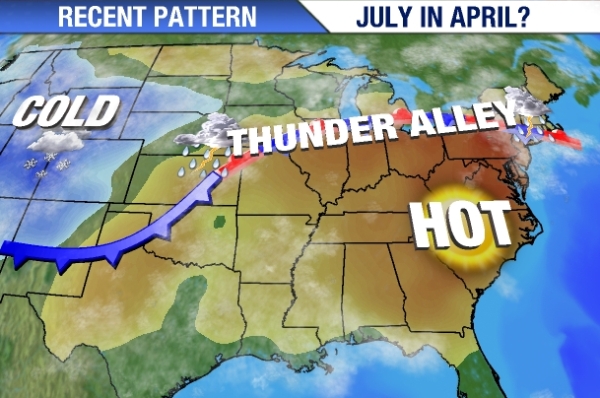
What people should be talking about are record highs versus record lows across the country. The figure above comes from a Weather Channel post by Jonathan Erdman, “July or April? Spring skipped?“:
To the south of this front, temperatures had soared into the 80s and, yes, 90s in many locations, shattering daily record highs. In fact, according to the National Climatic Data Center, in the seven-day period from March 29 through April 4, over 1100 daily record highs were either tied or broken in the nation!
Now that is a heat wave!
The data in the top graphic might remind you of this figure from a must-read 2009 study led by National Center for Atmospheric Research (see “Record high temperatures far outpace record lows across U.S.“):
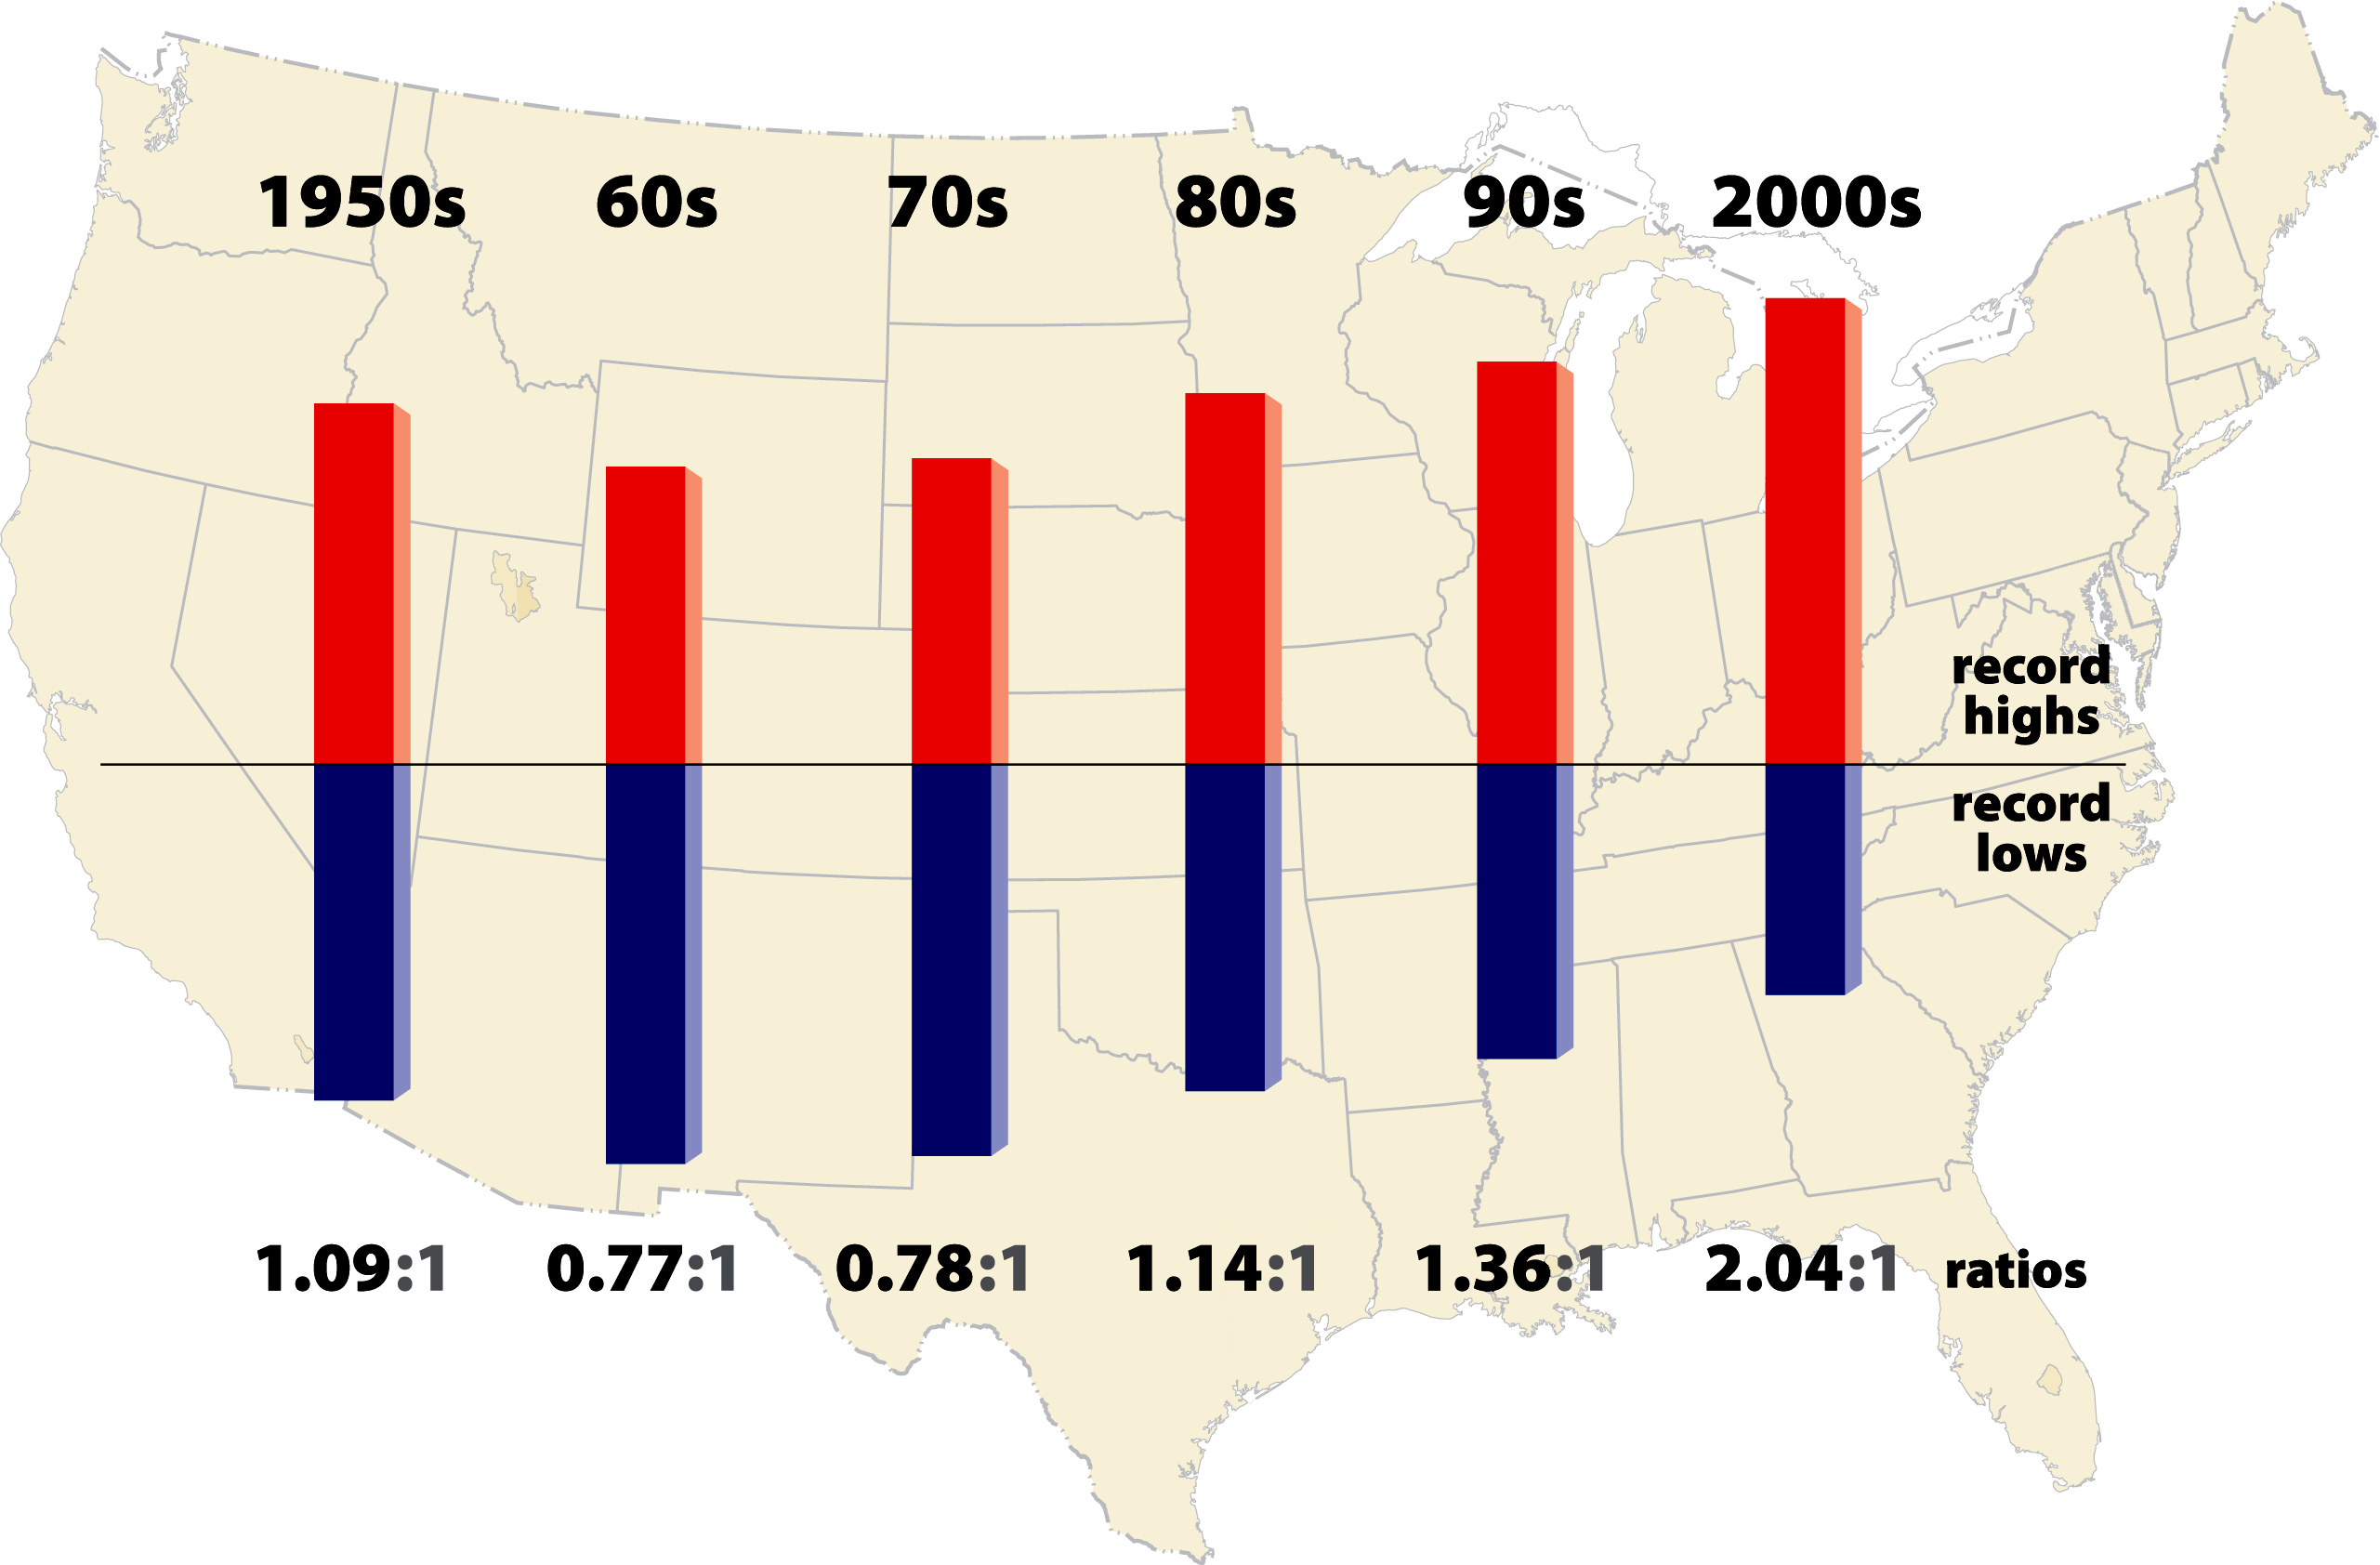
This graphic shows the ratio of record daily highs to record daily lows observed at about 1,800 weather stations in the 48 contiguous United States from January 1950 through September 2009. Each bar shows the proportion of record highs (red) to record lows (blue) for each decade. The 1960s and 1970s saw slightly more record daily lows than highs, but in the last 30 years record highs have increasingly predominated, with the ratio now about two-to-one for the 48 states as a whole. (©UCAR, graphic by Mike Shibao.)
NCAR begins its release on this study:
Spurred by a warming climate, daily record high temperatures occurred twice as often as record lows over the last decade across the continental United States, new research shows. The ratio of record highs to lows is likely to increase dramatically in coming decades if emissions of greenhouse gases continue to climb.
“Climate change is making itself felt in terms of day-to-day weather in the United States,” says Gerald Meehl, the lead author and a senior scientist at the National Center for Atmospheric Research (NCAR). “The ways these records are being broken show how our climate is already shifting.”
It’d be nice if the Weather Channel would say something close to that or at least mention the NCAR study if not the overall warming trend. Instead the piece opens with this:
To get a feel for what’s going on in the world’s weather, meteorologists look at weather patterns, namely, the juxtaposition of dips and rises in the jet stream that dictate the weather we feel here on the surface.
Yes, as we know, for many if not most weather reporters, it’s all just one of the greatest coincidences in human history (see “In yet another front-page journalistic lapse, the NY Times once again equates non-scientists — Bastardi, Coleman, and Watts (!) — with climate scientists” and “Is that airlifted snow on your Olympic ski mountain, or is your enormous helicopter just happy to see me?“)
Sadly, for the rest of us, assuming we keep doing what we’re doing, which is to say, nothing, NCAR predicts (and yes, they use the word “predictions” not “projections”):
The modeling results indicate that if nations continue to increase their emissions of greenhouse gases in a “business as usual” scenario, the U.S. ratio of daily record high to record low temperatures would increase to about 20-to-1 by mid-century and 50-to-1 by 2100.
In short, if you like the current heat wave, you ain’t seen nothing yet (see Our hellish future: Definitive NOAA-led report on U.S. climate impacts warns of scorching 9 to 11°F warming over most of inland U.S. by 2090 with Kansas above 90°F some 120 days a year — and that isn’t the worst case, it’s business as usual!”)
h/t WAG.
Related Post:
- Skeptical Science explains how we know global warming is happening: It’s the oceans.
- Watts not to love: New study finds the poor weather stations tend to have a slight COOL bias, not a warm one.
- Must-read AP story: Statisticians reject global cooling; Caldeira — “To talk about global cooling at the end of the hottest decade the planet has experienced in many thousands of years is ridiculous.”