As hundreds of millions of Americans change their lifestyles to flatten the COVID-19 infection curve, they’re inadvertently shifting energy supply and demand curves too.
On a typical, non-pandemic day, people use a lot of electricity in the mornings before they leave home for work and school, and even more when they return home in the evenings. To match that constantly shifting demand, power operators adjust how much power from conventional sources like coal, natural gas, and pumped hydropower goes onto the grid throughout the day. Plotted on a graph, the amount of power operators need to add to the grid forms a shape called a “camel curve,” with two gentle humps in the morning and evening and a midday dip between.
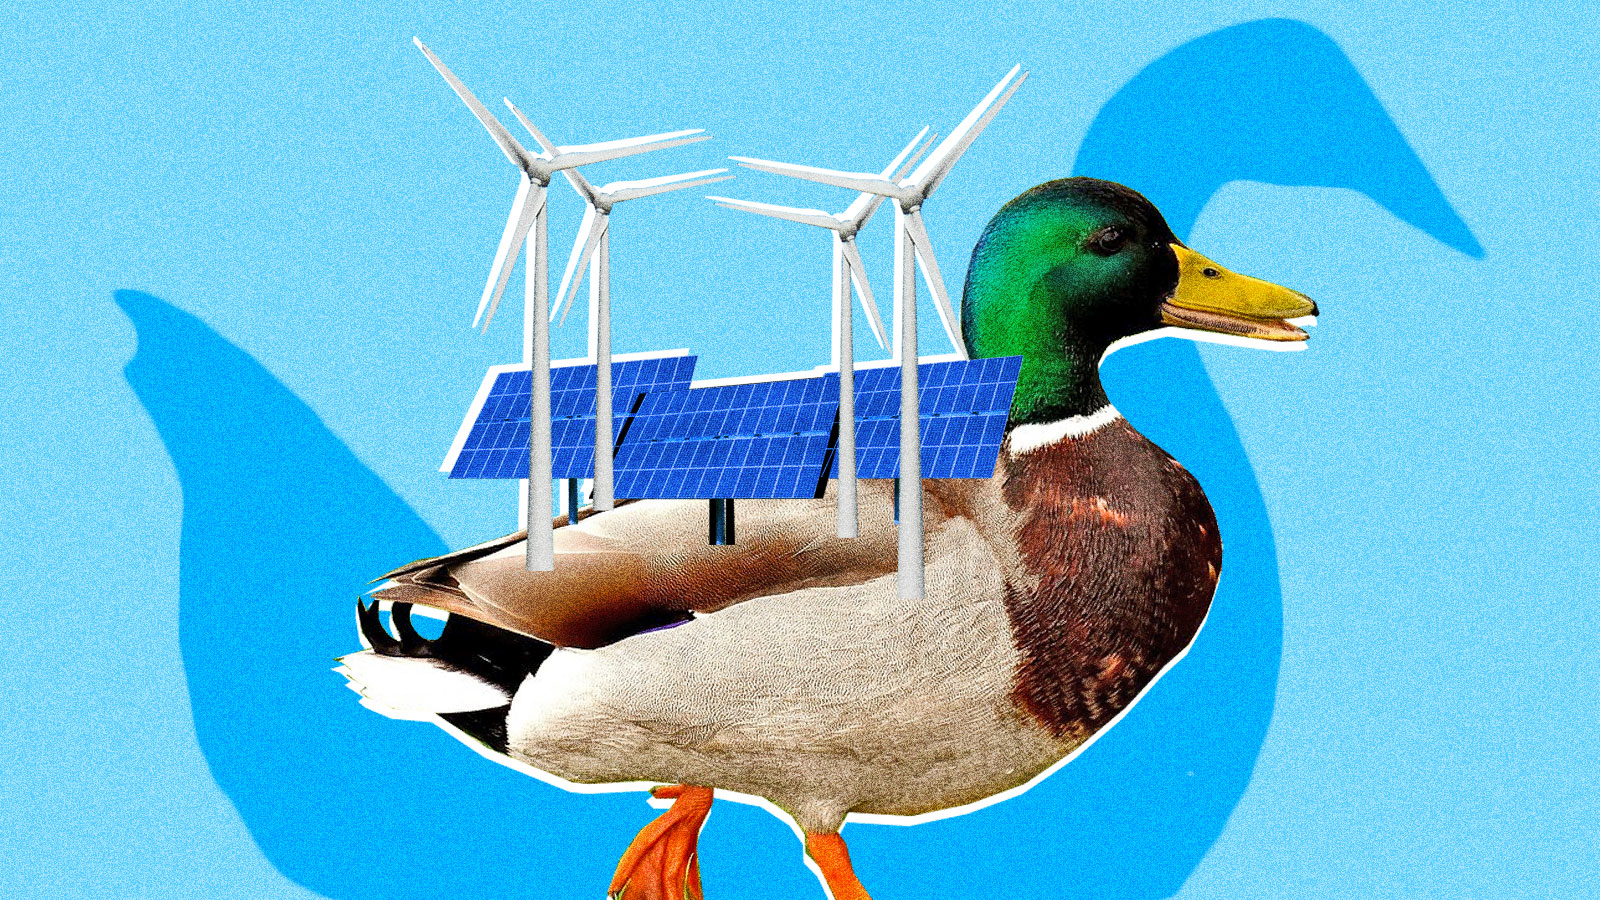
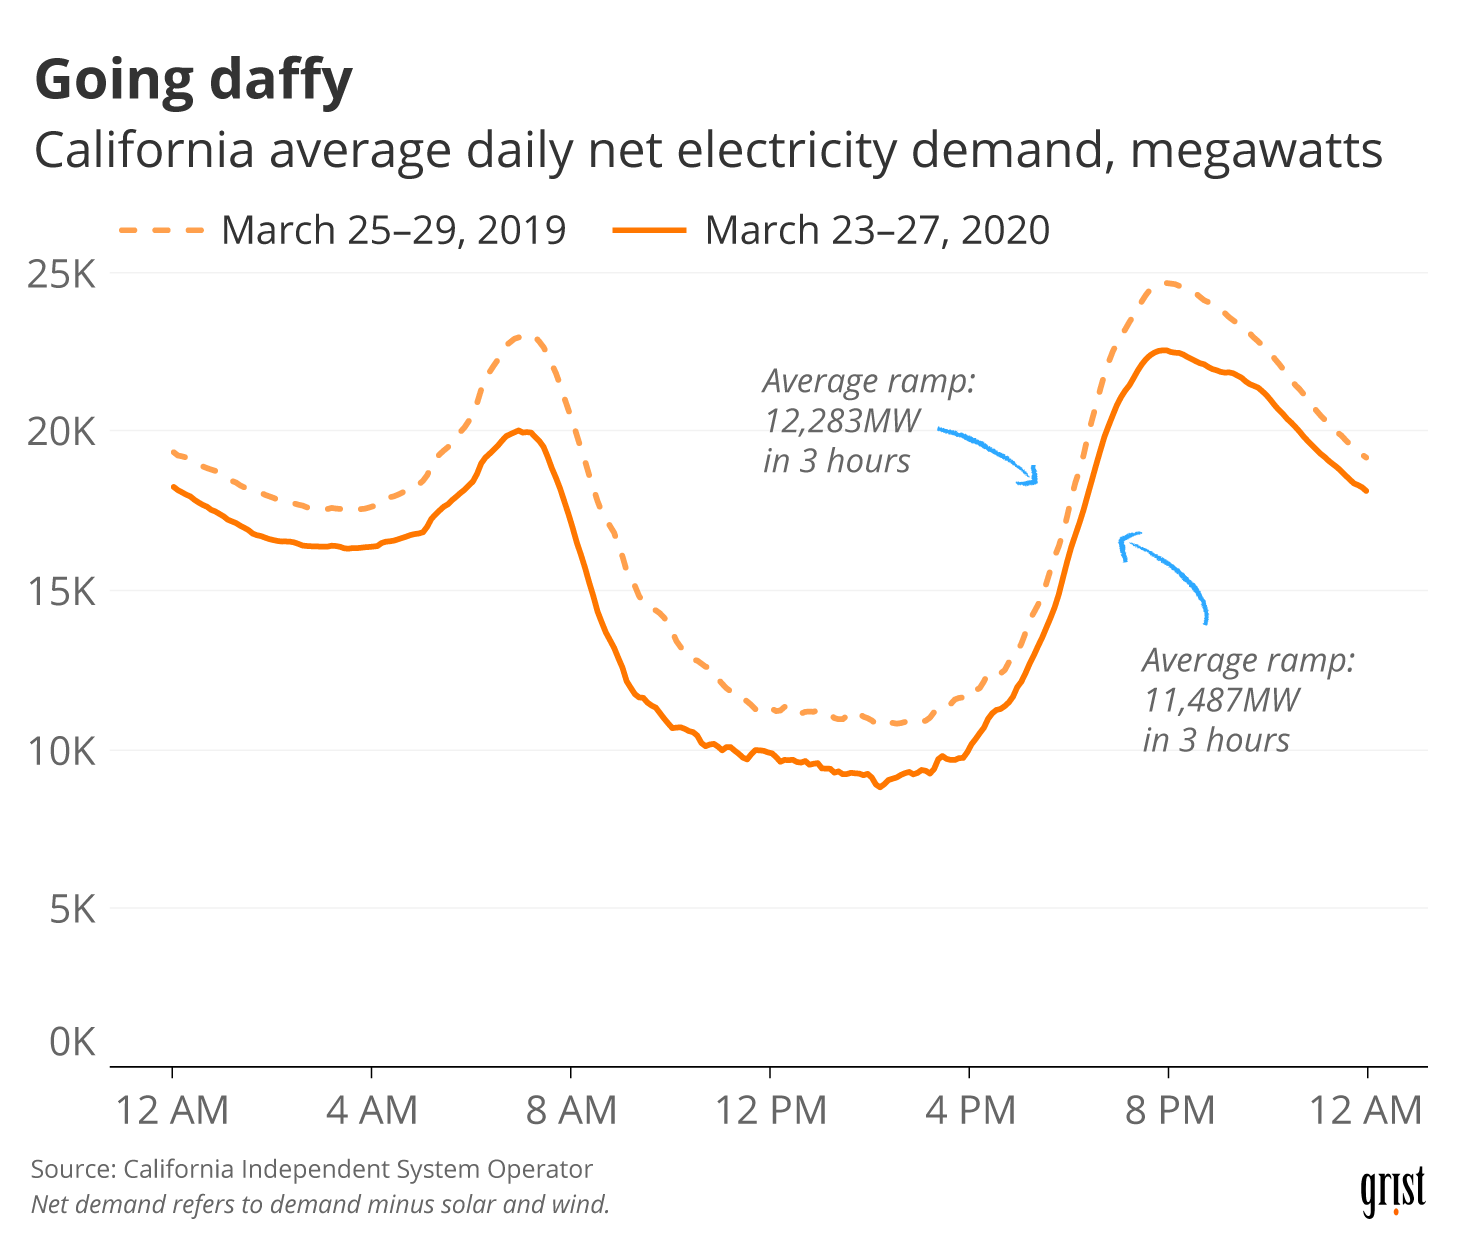
But when an electric grid gets a lot of power from solar energy, that graph of how much energy needs to be supplied from other sources over the course of the day forms the shape of a duck. Its tail covers the morning, its belly stretches over midday and afternoon, and its neck and head rise abruptly in the evening. That’s because the sun provides a lot of energy at a time when few people need it. In the middle of the day, when sunshine abounds and demand is low, power can be so cheap that suppliers will give it away to prevent overload. When the duck rears its head in the evening, right when the sun is going down, those round-the-clock energy sources like hydroelectric, natural gas, and coal pick up the slack. The “duck curve” is common in areas with lots of renewables, like California, which uses wind and solar for 23 percent of its electricity.
Grist
Of course, the exact shape of the net load curve for a particular place differs every day depending on how the wind is blowing, the sun is shining, and people are living. The global COVID-19 pandemic isn’t changing how much solar energy we’re getting, but it’s definitely shifting demand for electricity — and changing the shape of those ducks and camels that show us how much non-solar, non-wind energy we need on the grid throughout the day.
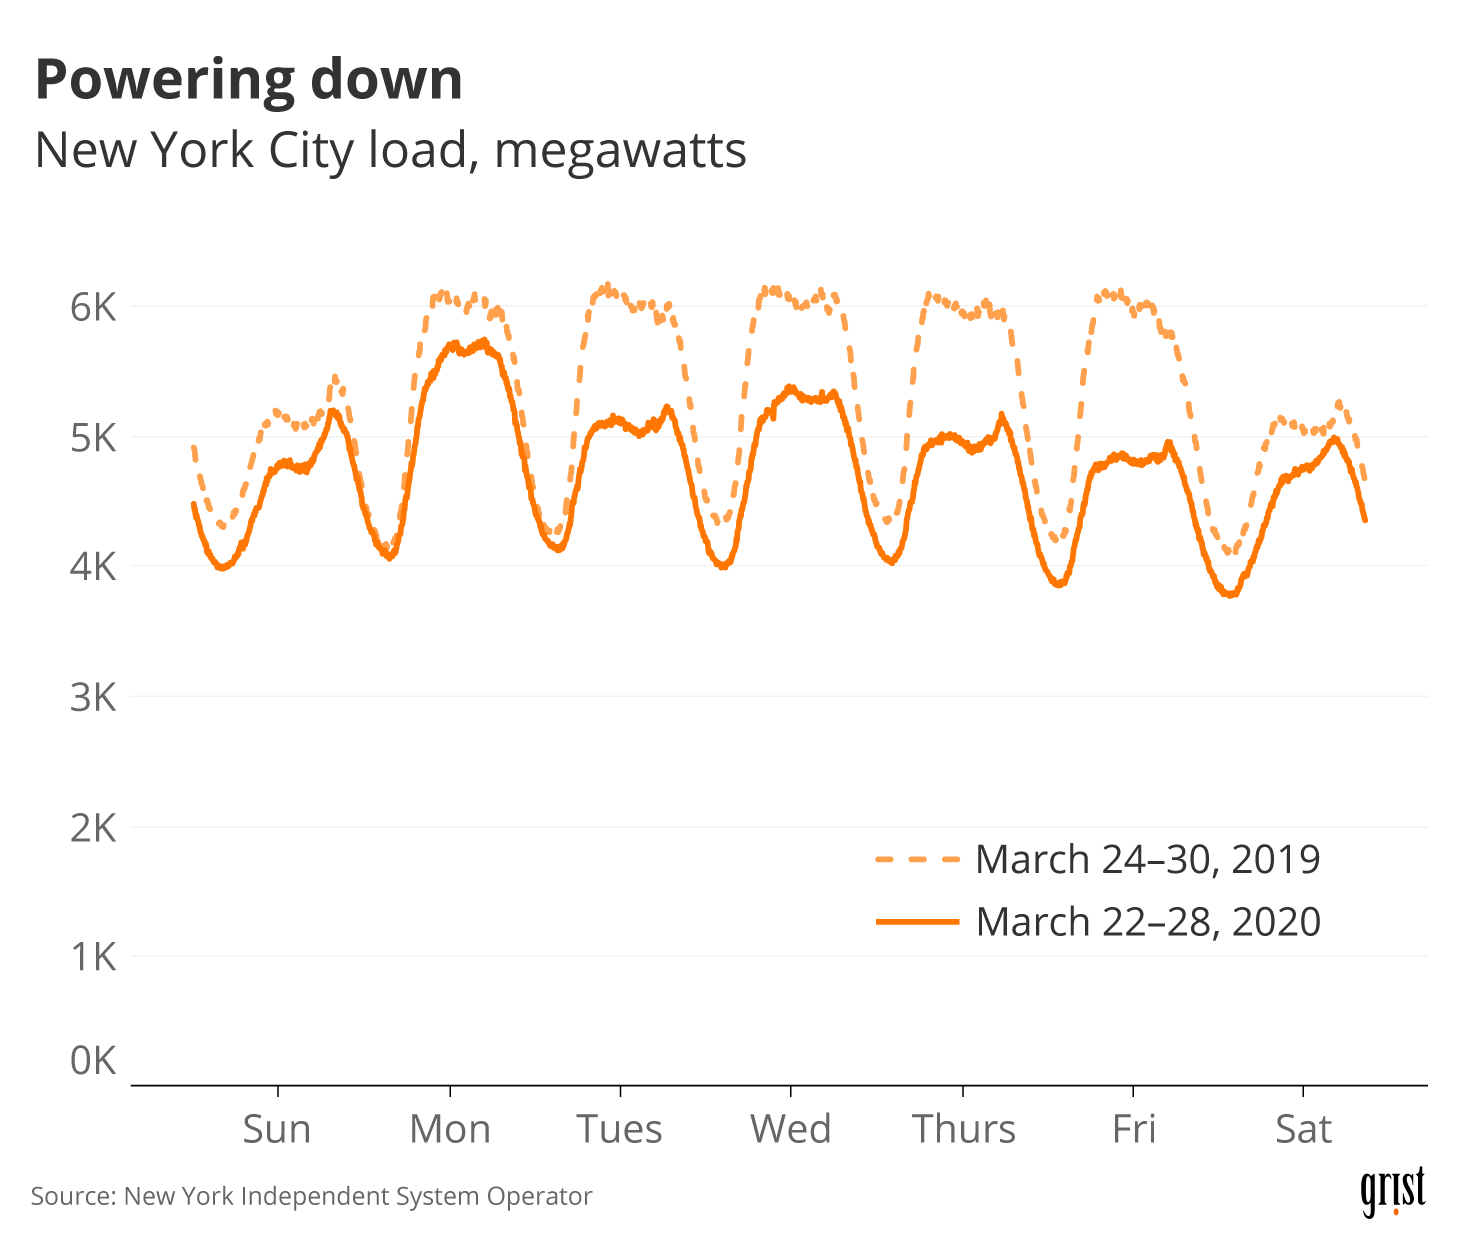
Thanks to shuttered businesses and stay-at-home orders, camel curves appear to have less defined humps, while solar-heavy, duck-shaped grids, like California’s, seem to have developed a rather shapeless tail and a shorter neck.
Clayton Aldern / Grist
“Traditionally, we see a rapid increase in demand … as homes and business begin daily activities,” writes the New York Independent System Operator (NYISO). But social distancing and the closure of non-essential businesses seem to have killed the early morning hustle out the door, with the NYISO observing “a later and more gradual morning ramping period, resulting in demand about 6-9% lower between 6 and 10 AM.”
Clayton Aldern / Grist
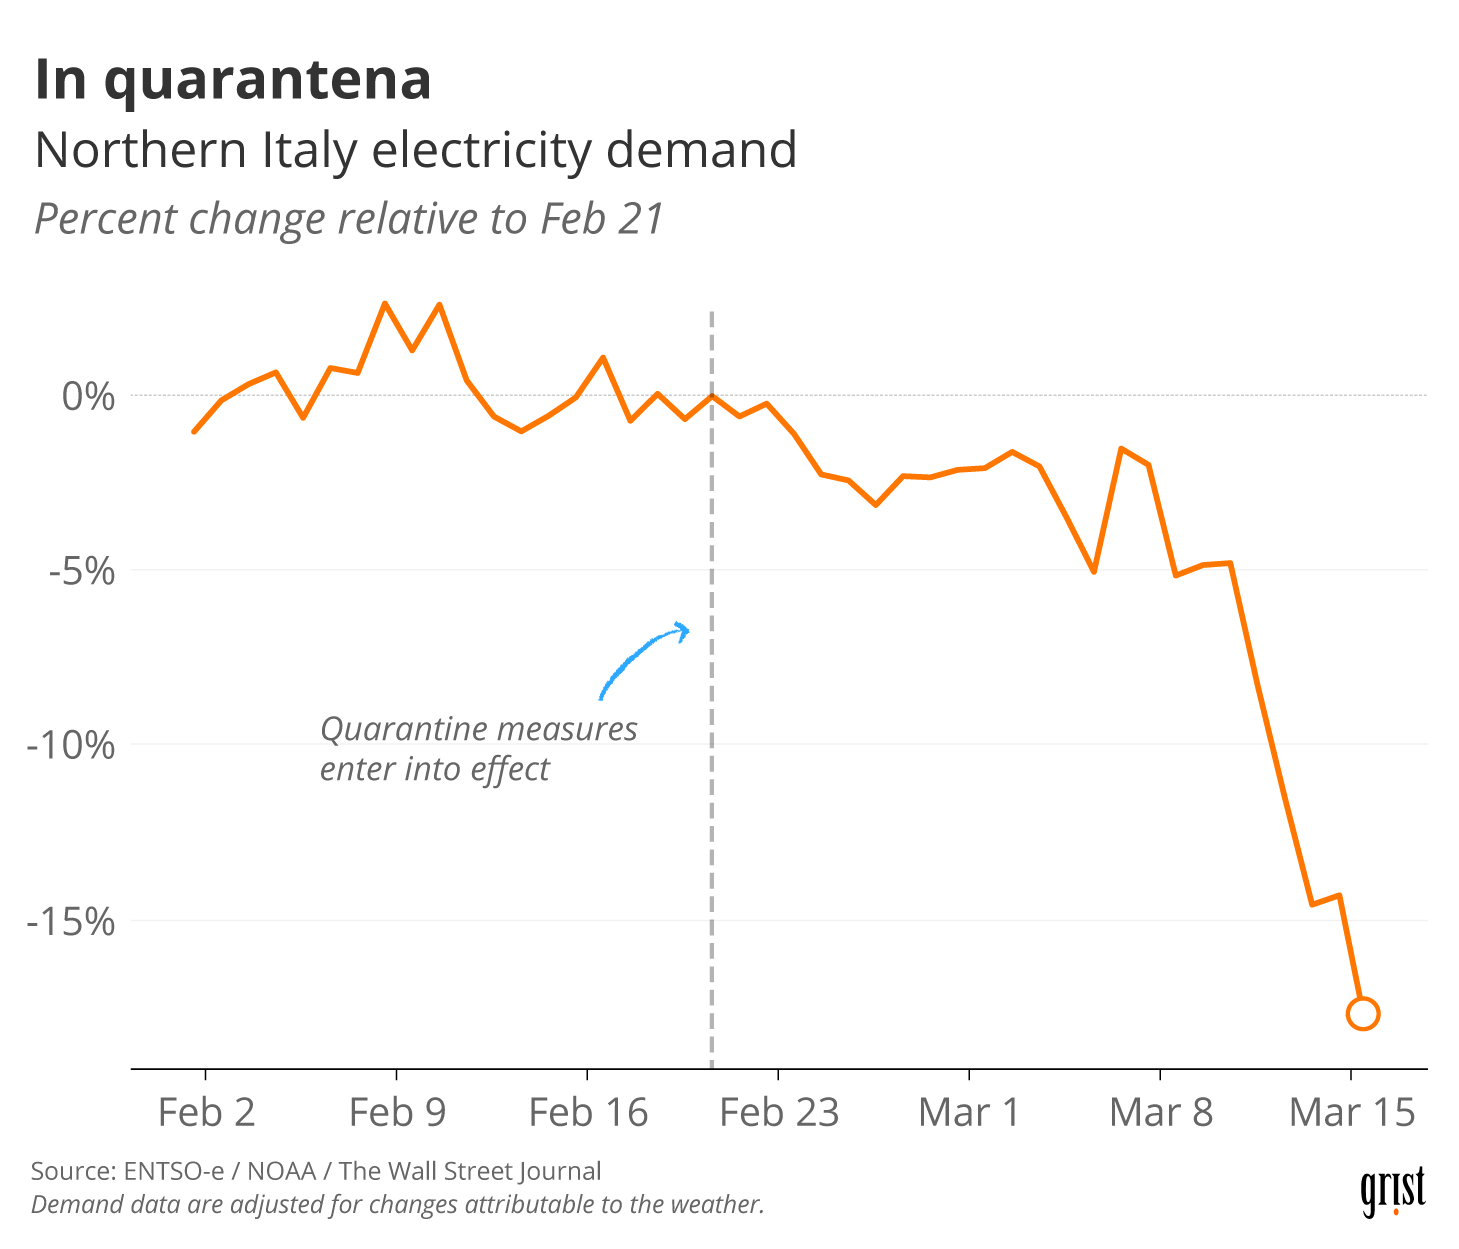
Across the board — including in Europe — the changes to the power demand seem most dramatic on weekdays, and subtler or negligible on weekends. Mornings also seem to have changed more than evenings. In the U.K., the low overall energy use combined with a strong wind and solar supply led to households actually being paid for using electricity during the day for the first time.
Slower mornings aren’t the only electric grid shift happening because of social distancing. Overall electricity use is down by about 2 percent in New York and between 2.5 and 7 percent in California, California’s transmission organization told Grist. The Midcontinent Independent System Operator, which coordinates power supply for 15 states and one Canadian province, has logged an 18 percent drop in demand compared to last March. These declines suggest that the electricity saved in office buildings and businesses more than compensates for a residential use increase with everybody staying home.
Clayton Aldern / Grist
The pandemic behind the recent changes in demand is unprecedented in our lifetimes, but power operators are used to uncertainty. In a March 25 blog post, the NYISO pointed out that “changes in human behavior and the calendar constantly impact the grid,” citing holidays and weather events as more common disturbances the energy system is accustomed to dealing with. Whether you have a duck curve, camel curve, or something in between, your power grid is probably in good shape for now.