👋 Hi everybody, it’s Jake Bittle — Claire handed me the reins this week to share a unique story I stumbled across recently. I’m fascinated by a question that plagues the energy transition: What do we do with former fossil fuel power plants and the contaminated sites around them? As hundreds of hulking old plants get replaced by solar and wind farms, I visited a project along the coast of Connecticut that offers a powerful example of how we might reimagine and repurpose our obsolete energy infrastructure.
Also this week, news on the future of California’s long-delayed high-speed rail project, and the race to stay ahead of rising temperatures.
This post originally appeared in Grist’s weekly solutions newsletter, Looking Forward. Not on our list yet? Subscribe here to get it in your inbox every Friday.
A new life for a power plant
Courtesy of Manresa Island Corp.
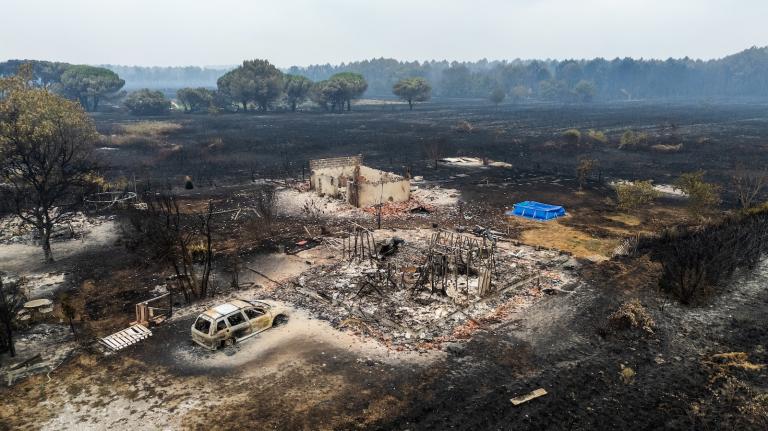
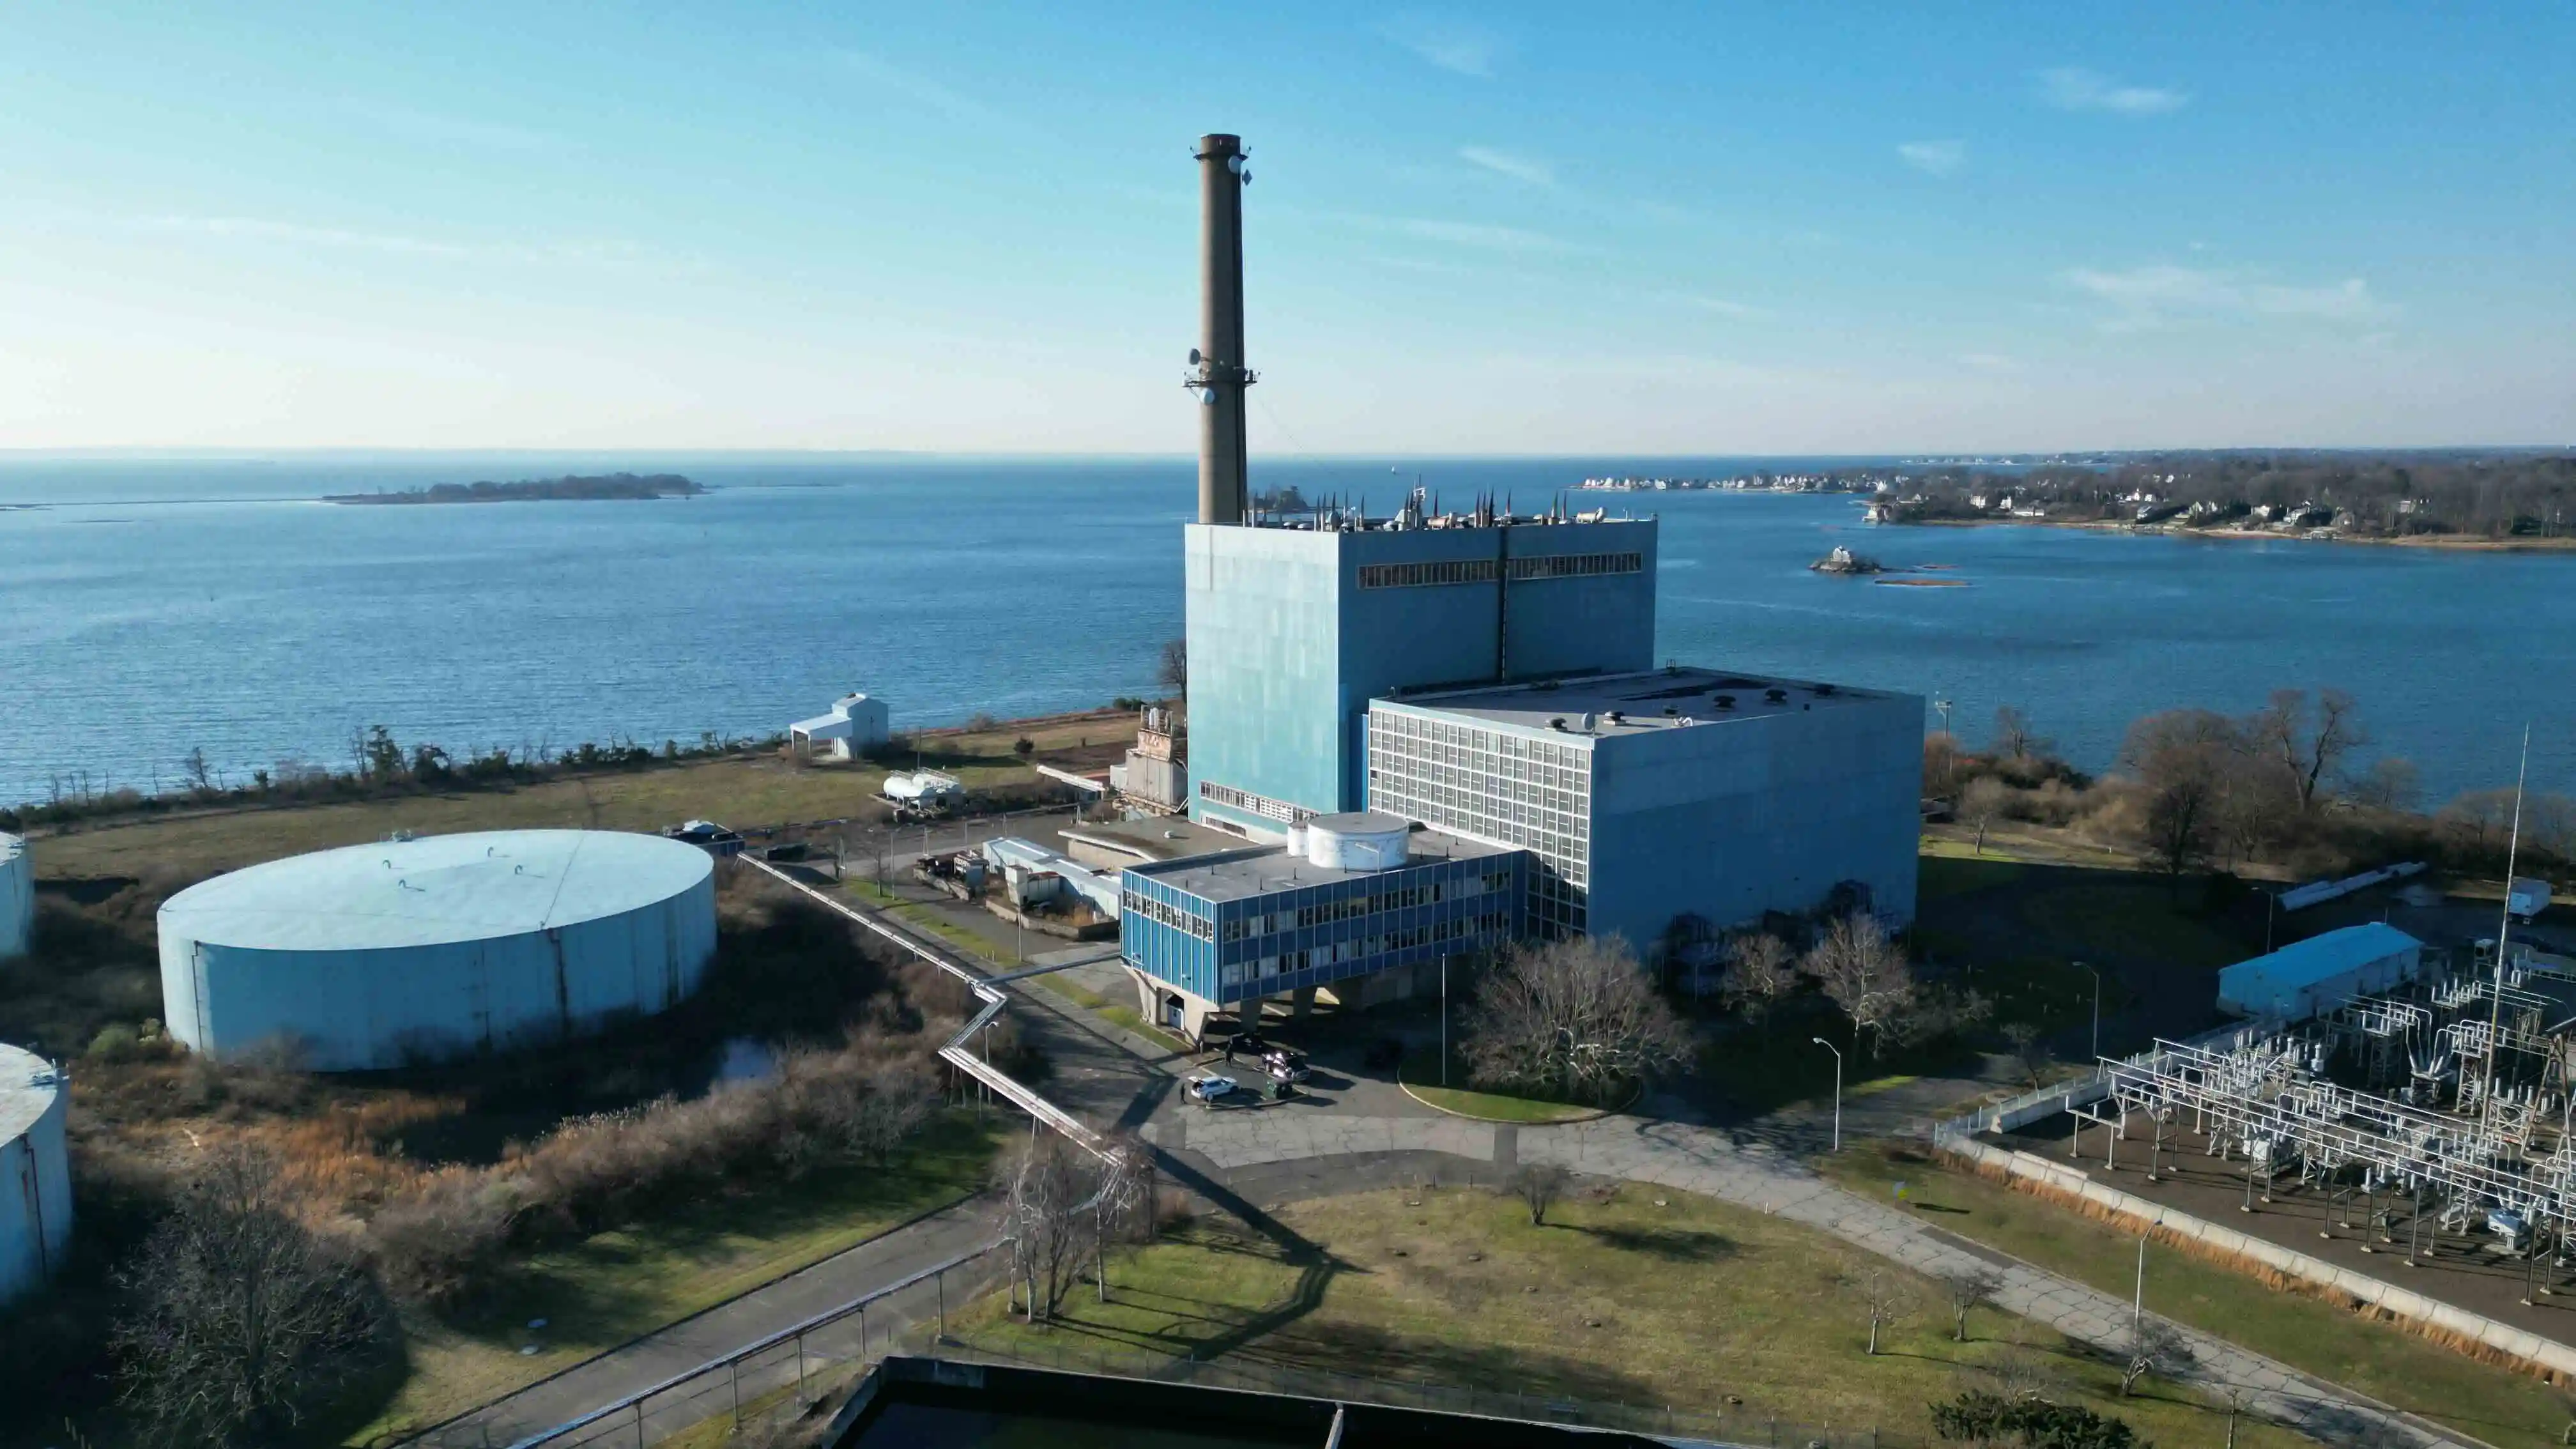
Earlier this year, I visited a decommissioned coal plant on Manresa Island in Norwalk, Connecticut. At first glance, it was a familiar, somewhat disheartening site — a carcass of abandoned infrastructure bulging out of an otherwise tranquil coastal landscape. Across the country there are hundreds of power plants that have been abandoned as their fuels become increasingly obsolete, creating a huge cleanup problem that many utilities lack the money and expertise to deal with. But I was looking at Manresa Island through different eyes, envisioning the public park and gathering space it will someday become.
A little history: During the postwar boom times of the late 1950s, a utility called Connecticut Light and Power purchased Manresa Island. Despite protests from nearby neighbors concerned about pollution, the company transformed the slim island into an industrial complex that could power around a quarter of a million homes As the utility burned through coal, it deposited the fly ash nearby, over time expanding the island by more than 100 acres.
The utility later refurbished the power plant so it ran on fuel oil, but by the turn of the century it was already obsolete. Connecticut’s grid is now dominated by cheaper, more efficient natural gas, and it is pushing to replace much of that with offshore wind from nearby Long Island Sound. Activist groups fought to close what was by then one of the state’s dirtiest power plants, and Superstorm Sandy helped their case when it flooded the plant in 2012.
Connecticut Light and Power shuttered the plant after the storm, but with no one to clean it up, the plant sat abandoned for more than a decade. It might have remained that way forever were it not for Austin McChord.
The Connecticut native made a fortune in tech, and he had been looking for the right philanthropic outlet. While kayaking near the power plant one day, he and his wife came up with the idea of transforming the polluted island into a park and community space.
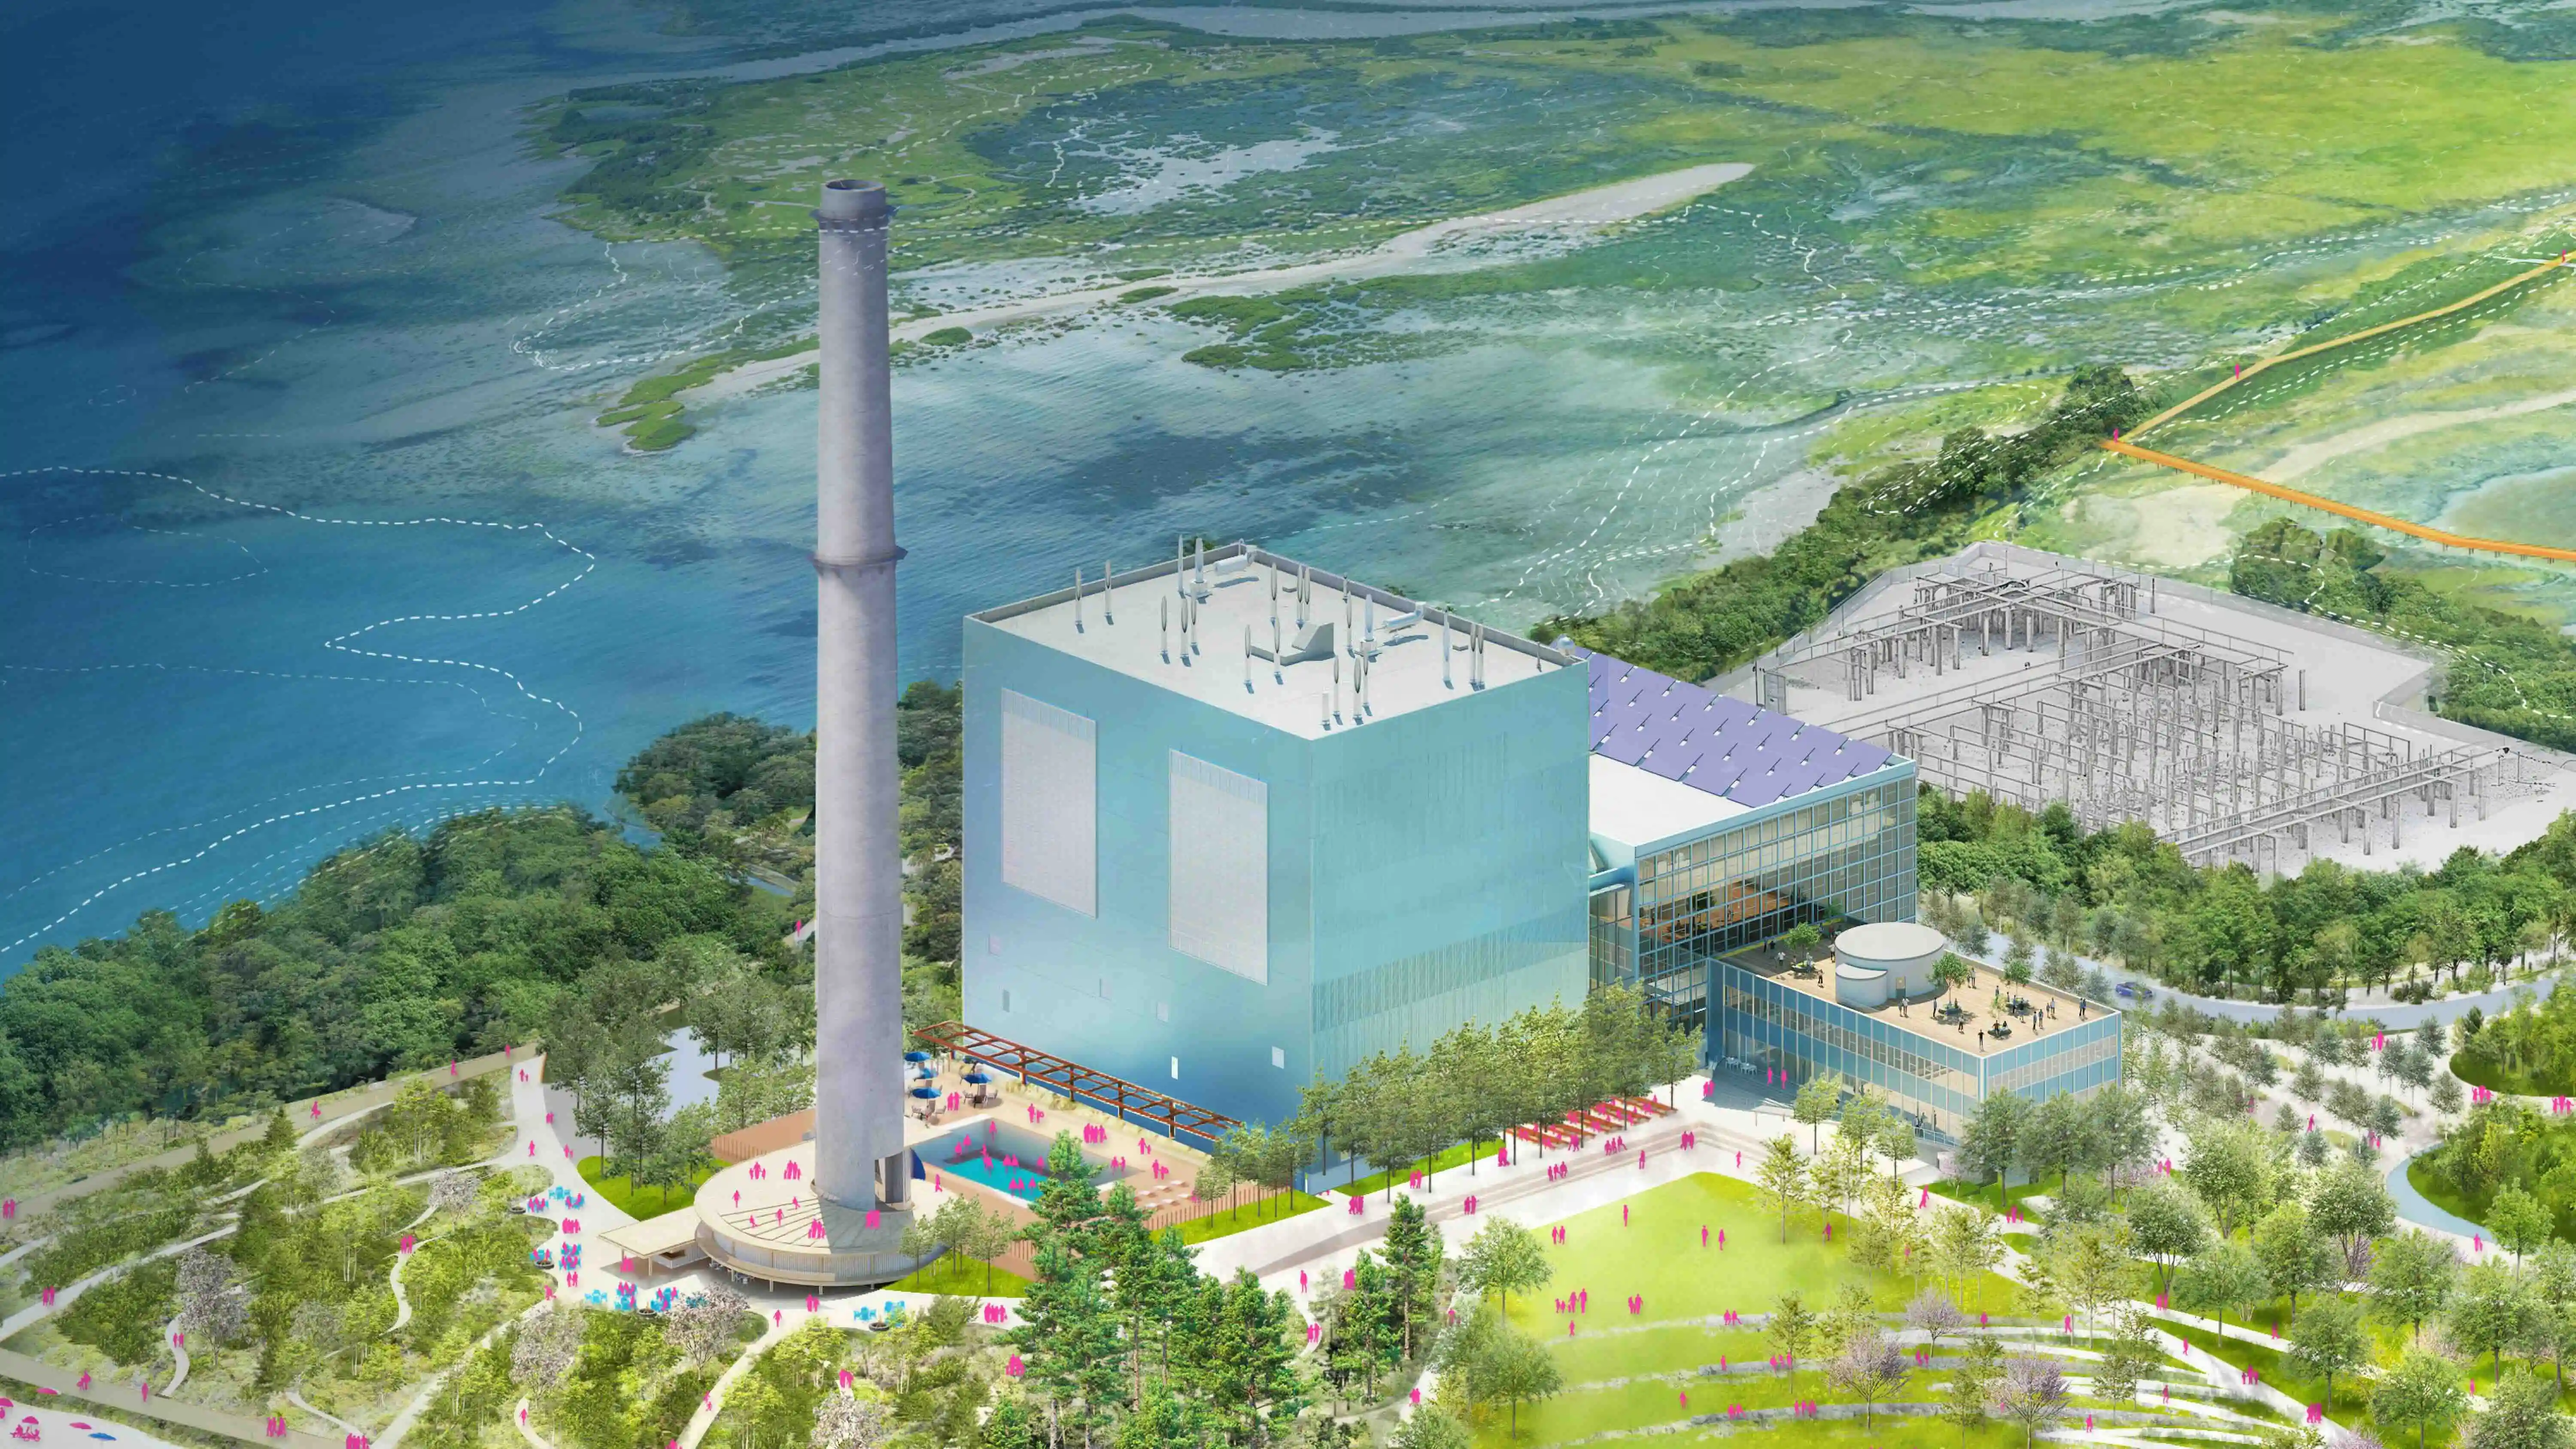
A drawing shows what the site will look like after the remediation. Courtesy of Bjarke Ingels Group
The McChords bought the island in 2024, and they’re now close to moving the first earth on the remediation. No one in the United States has ever attempted to repurpose a fossil fuel power plant for public use like this, and the complexities are immense — engineers will have to cap the site with soil and rock barriers, replant a birch forest that’s grown up on the coal ash deposit, and install permeable barriers that will prevent chemicals from leaking into the ocean.
But once this cleanup is done, the island, renamed Manresa Wilds, will become the kind of third place that is all too rare on Connecticut’s working waterfront. The turbine hall that once housed fossil fuel power generation will become a flexible event space. The grounds will feature dozens of acres of walking trails, plus a new marsh habitat for endangered species, and the former smokestack will overlook a public pool.
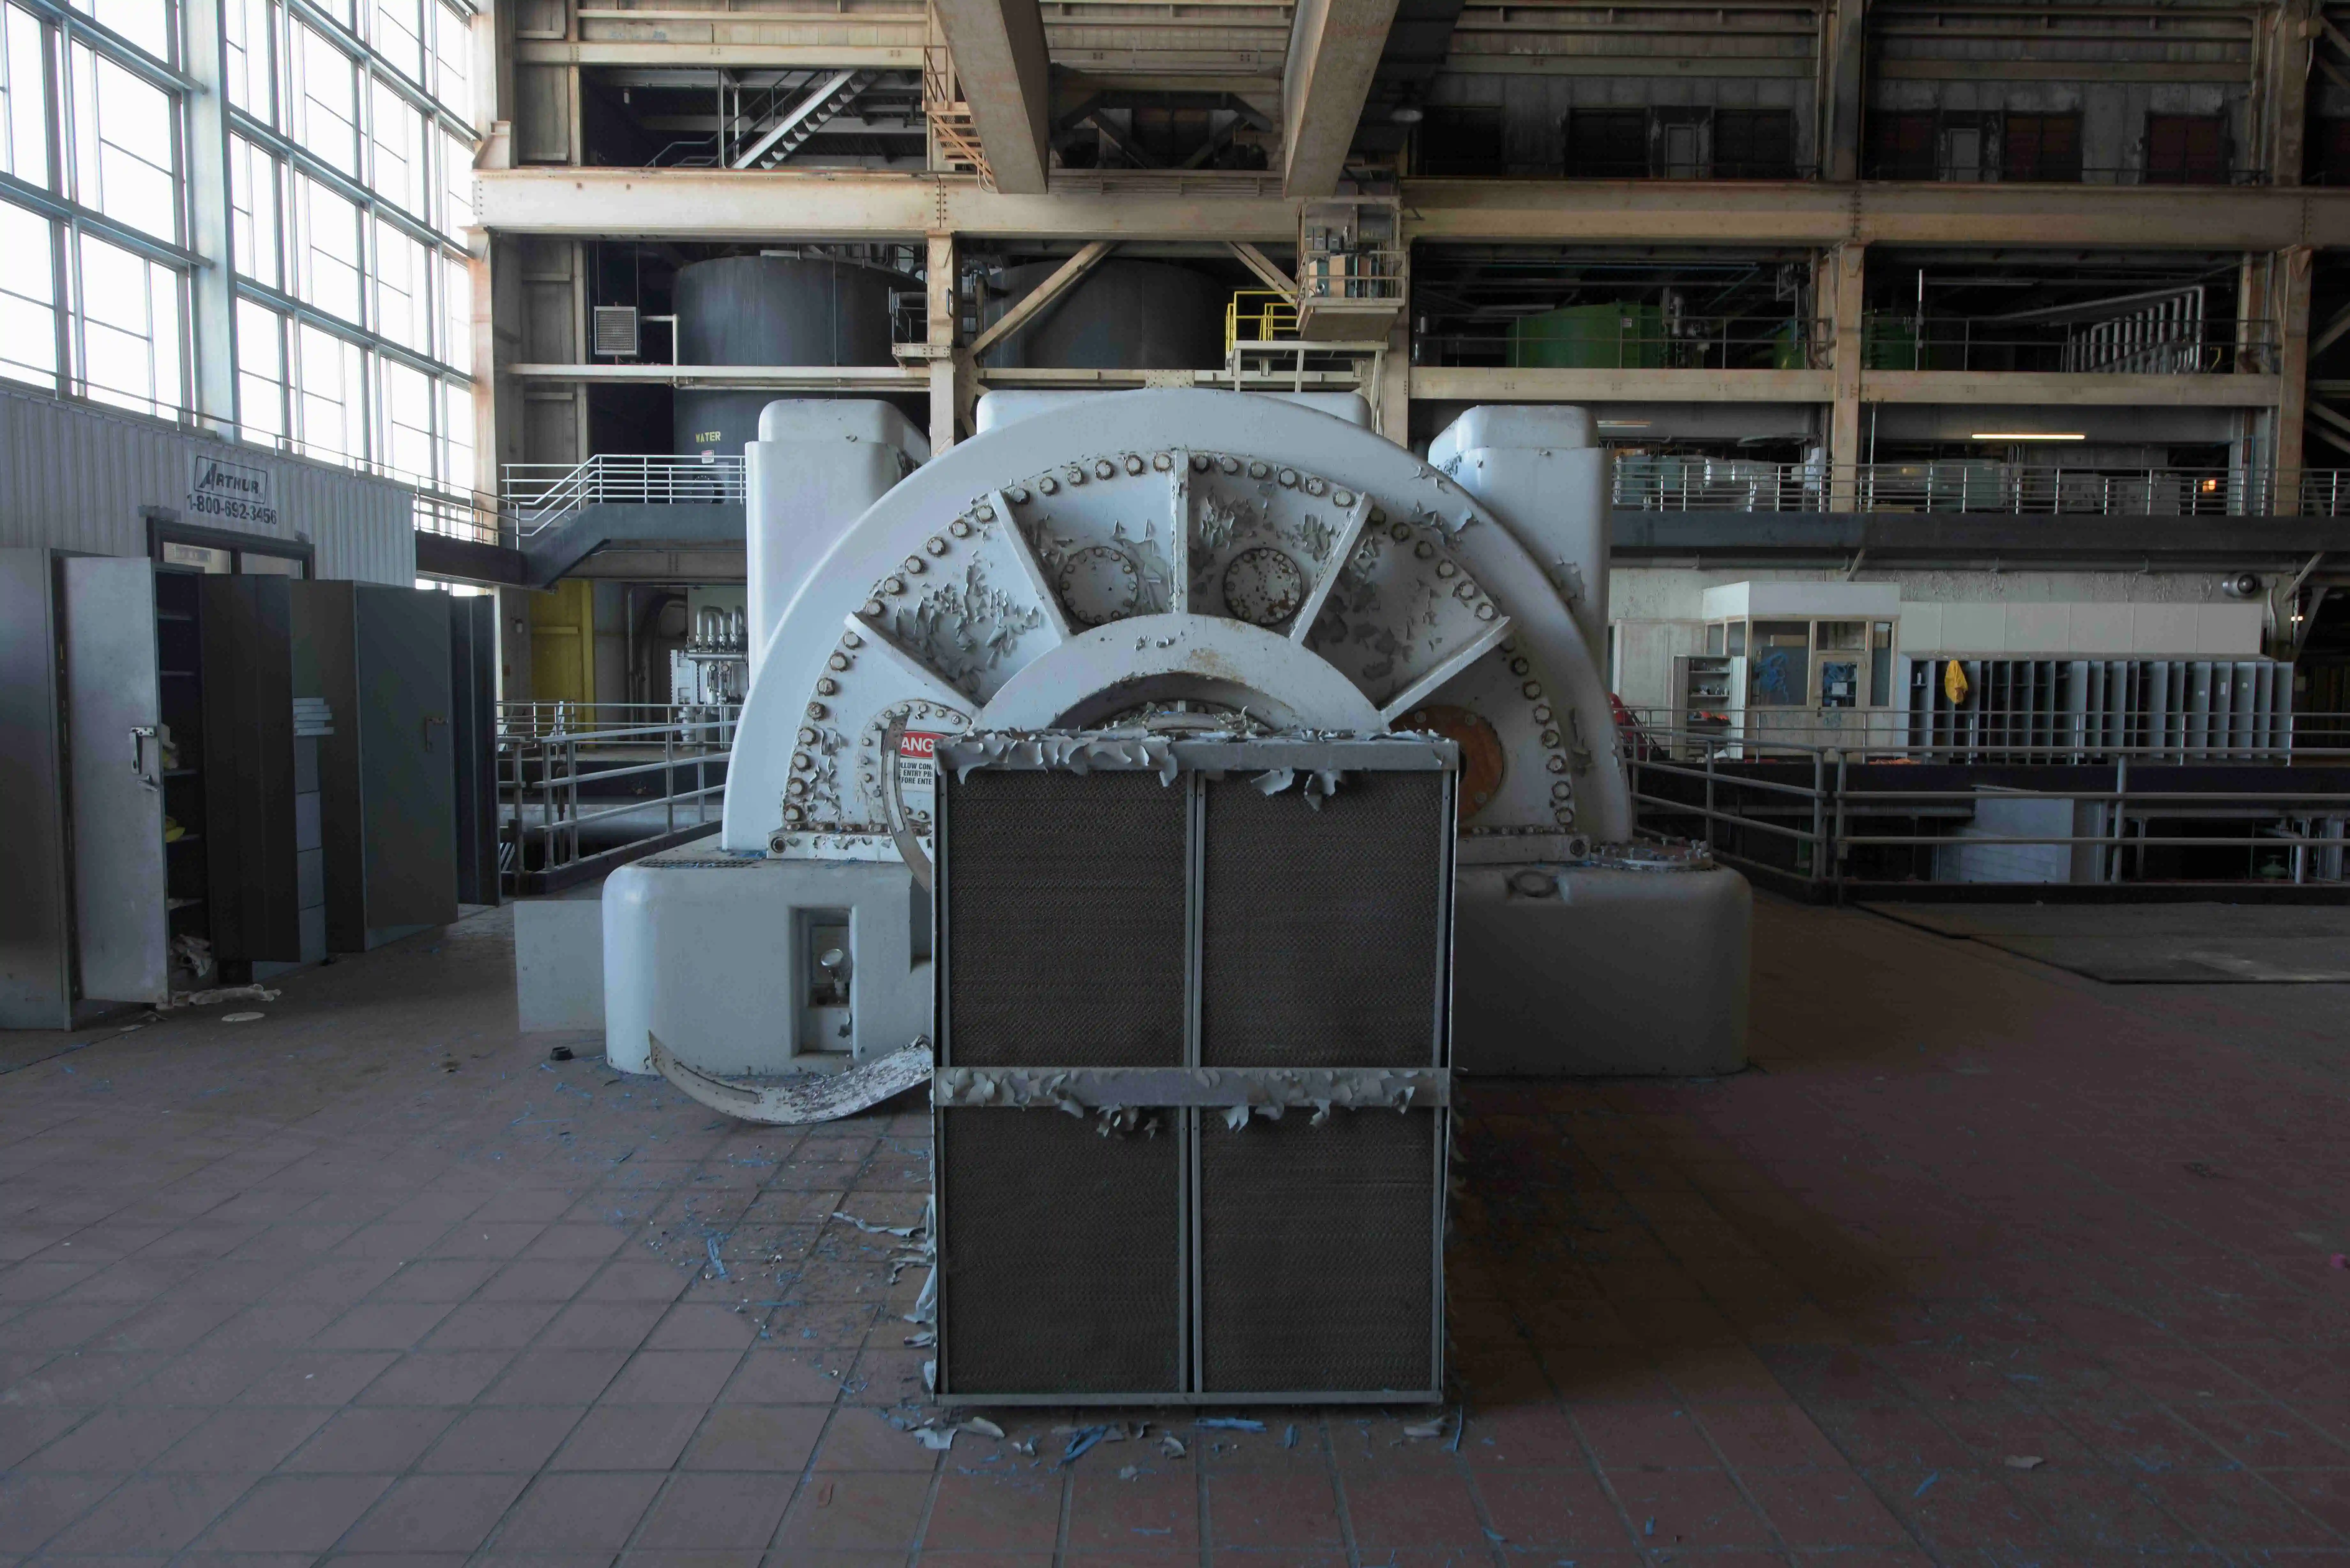
A view inside the defunct power plant. Virginia Hanusik
As I walked around the former plant, I found myself moved by the sheer scale of the facility. In the climate world, we often dismiss these small coal-fired plants as clunkers, the dirtiest and most basic tools for generating power, but the complexity of the plant astounded me. The two cylindrical turbines in the great blue hall were surrounded by hundreds of feet of metal scaffolding and a labyrinth of multicolored pipes. The control tower that abuts the turbine hall was frozen in time from the moment after Sandy hit, with old coffee cups gathering dust on the counter and safety jumpsuits still dangling on hangers.
The idea that this behemoth could become a gathering place for student theater companies and birdwatching groups filled me with emotion. It seemed a fitting tribute to the 20th century, a time full of stunning achievements and grievous mistakes. We no longer need the polluting machines that previous generations devoted their lives to building and operating, but that doesn’t mean we need to rip them all down. With the right vision, and the right commitment, we can find new ways of using the things they built.
“We have this fun chance to tell a story about the structure and about how things used to be,” said McChord. “Fifty years from now, you know, kids will be like, ‘What the fuck, you burned coal? Why would you do that?’ The whole thing will seem strange.”
This restoration will cost well over $400 million, a huge chunk of the McChords’ wealth, but they believe it will be worth it. Austin said his goal is not only to transform the landscape of the community where he grew up, but to show other places how they can repurpose their legacy infrastructure for good — one reason why he decided to preserve so much of the structure. There are dozens of other retired power plants in Connecticut alone, with more slated to retire soon, and no one has any plan for what to do with them.
“There will be hundreds of other sites, similar to this one, that need to find new lives, and the fact that we can show an example of what can happen is really cool,” said McChord.
Correction: A previous version misstated plans for the turbine hall.
More from Grist
🤫 The talk of the town
A new report pushes back against the “climate hush” that has fallen over the Democratic party since the 2024 election; it shows that talking about climate issues can be helpful for campaigning politicians, even though climate is still not a top priority for most voters. Read more
🚃 Never break the train
California’s long-delayed high-speed rail project may get some help from the private sector. A consortium of companies is now looking at ways to advance the project, including possibilities like merchandising and business development around stations. Read more
☀️ Too much sun
China has built up its solar panel manufacturing industry so much that it now has an oversupply, which has led to tumbling prices. But while these companies are losing money in the short term, the country is continuing to invest in the long-term growth and advancement of its solar industry. Read more
In other news
- People are terrible at estimating how others feel and act on climate, according to a new study, but this ‘perception gap’ can be overcome (Carbon Brief)
- Summer camps are developing protocols to keep kids safe from increasing heat and wildfire smoke, and asking for more guidance from authorities (WBUR)
- Indonesia is shutting down open dumping to reduce methane emissions from decomposing waste. The AP looked at what it means for the waste pickers who rely on landfills to survive. (The Associated Press)
- As Europe wilts under punishing heat, CNN visited a plaza in Rome that highlights innovative adaptations and the challenge of staying ahead of rising temperatures (CNN)
- An ambitious project aims to link Yellowstone all the way up to the Yukon in a massive wildlife corridor (Mongabay)
And finally, looking forward to …
… a world where future generations can enjoy the reimagined infrastructure of the fossil fuel age, and indeed find its history strange.
🌱🛝🌱
You look on with watchful eyes as your kids go down the water slide again and again — famously the tallest in the region (and completely safe, you remind yourself). In the summer, you and your family spend almost every day at The Plant.
Your kids are too young to understand the significance of the name. Your daughter still calls it “the plants,” maybe because of how much she loves tending your plot in the community garden. But one day they’ll learn about the site’s history — how their beloved water slide used to be a “smokestack,” a word unfamiliar to them.
— a drabble by Claire Elise Thompson
🌱🛝🌱
A drabble is a 100-word piece of fiction — in this case, offering a tiny glimpse of what a clean, green, just future might look like. Want to try writing your own (and see it featured in a future newsletter)? We would love to hear from you! Please send us your visions for our climate future, in drabble form, at [email protected]
👋 See you next week!