The natural gas revolution will not be televised, because it’s not fun to watch. But it might provide the power for your television, if that counts — and if you live in the Southeast, the odds that it does are climbing.
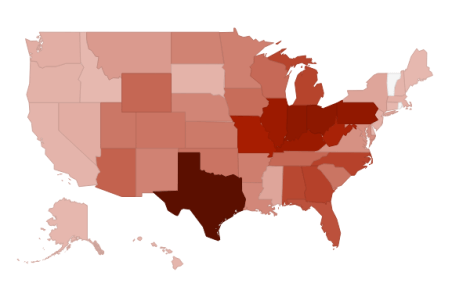
States in the Southeast use a lot of coal. On this map, the darker states produced the most coal power in 2011. The Southeast is pretty dark, though less so than Texas and the Rust Belt.
But that percentage is dropping, year-over-year, as the U.S. Energy Information Agency noted today.
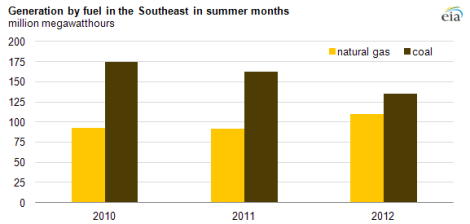
The electric power industry in the southeastern United States has undergone substantial changes over the past three years. While coal-fired power plants continue to generate more than half of electricity in the region, coal-fired generation has declined since 2010, and production from natural gas-fired plants has increased. This change can be primarily attributed to changes in the relative prices of natural gas and coal, which altered the dispatch order of power plants in the region.
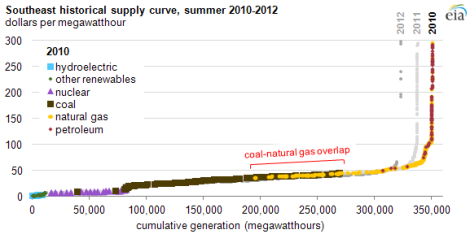
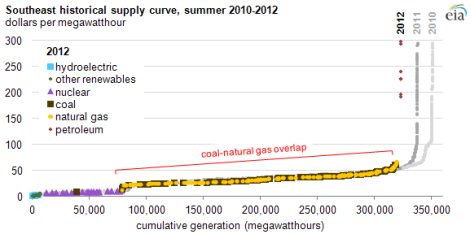
This is the same story, over and over again. Natural gas is cheaper, so people use less coal. The EIA provided the two following charts as well, showing generation as a function of cost for various facilities in the Southeast. The more expensive the type of fuel, the less likely it was to be used.
Here’s what the curve looked like in 2010. Note the yellow dots: Those are natural gas facilities, which came online as demand increased over the summer. Petroleum production (the red dots) is very expensive, so only when demand increased enough was it used. Coal took precedence over then-more-expensive natural gas.
And here’s this year. Natural gas was used alongside coal, because it is much more affordable.
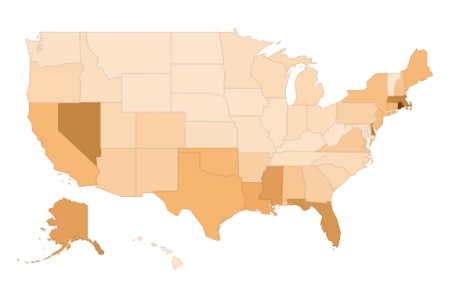
Note that the Southeast is still not the region most in need of transition. Here are two more maps: The first shows coal as a percentage of each state’s total production, with darker states being more coal-reliant. The second shows natural gas as a percentage of each state’s production.

The increase in use of natural gas has helped drop our carbon dioxide emissions — but there’s a lot of work to be done.
There is only one factor that is prompting the switch from pollution-heavy coal to pollution-(relatively)-light natural gas: economics. Electricity providers are not switching from coal because they love Mother Earth. In other words, the natural gas revolution isn’t even a revolution. It’s just power companies using a coupon.
The coupon-using will not be shown on your natural-gas-powered television. Catchy.
