[See updates below.]
It’s no secret that the fossil-fuel industry produces many of the talking points Republicans use to scare voters about energy legislation. Usually, though, dirty energy execs don’t literally sign on as authors.
House Republicans are circulating a PowerPoint document that purports to show the regional breakdown of costs for energy consumers under the Waxman-Markey climate and energy bill (ACES). The header: “Most States Lose Under the Pending Climate Bill.”
The catch? It appears to have been authored by the coal giant Peabody Energy. [Note: It was actually authored by the National Mining Assocation; see updates below.]
The document was discussed on a conference call held by the “Rural America Solutions Group” within the GOP caucus on Thursday, hosted by group co-chairs Frank Lucas (R-Okla.), Sam Graves (R-Mo.), and Doc Hastings (R-Wash.). According to a press release, the call was meant to “highlight how the Democrats’ National Energy Tax will make it more expensive for rural Americans to fertilize the crops, put fuel in the tractor and food on the table.”
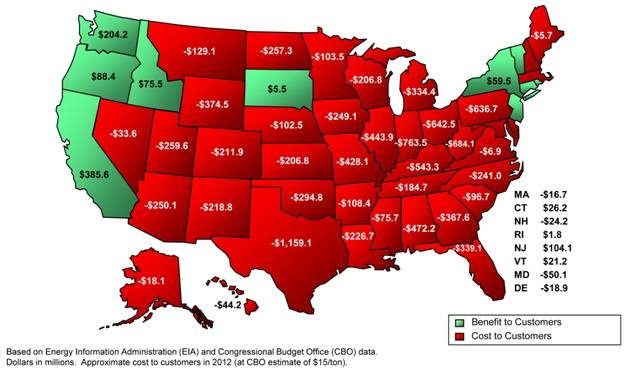
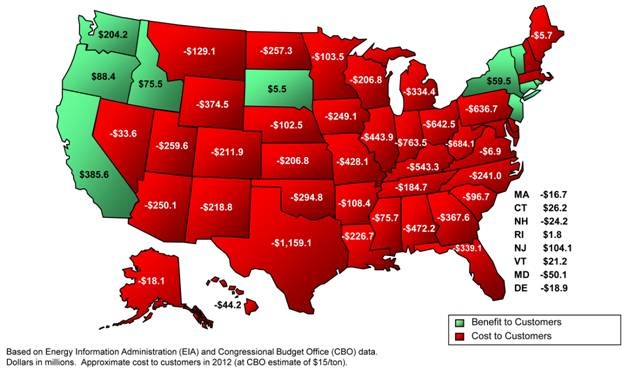
The document’s map (see below) shows most of the country losing out under the climate bill and facing higher energy costs, while just a handful of states on the West Coast and in the Northeast would benefit. Texans, for example, would lose $1.16 billion in 2012, while Californians would gain $385.6 million.
A line at the bottom of the document reads, “Based on Energy Information Administration (EIA) and Congressional Budget Office (CBO) data” — but there’s no indication of the particular studies used. (The CBO numbers likely come from a report that the CBO itself says is not about Waxman-Markey and almost certainly overstates costs, since it only quantified costs, not benefits.)
Dig a little deeper by looking at the “properties” of the PowerPoint document and you learn that it was produced by Peabody Energy — with CEO Greg Boyce listed as the “author” and communications services manager Chris Taylor listed as the “manager.” Yes, the world’s biggest coal producer is literally writing Republican talking points. Oops!
Here’s the map:

UPDATE: Roll Call ran a story ($ub req’d) on June 18 on Democratic infighting over the ACES bill, noting that one Democrat has been touting a map that sounds a whole lot like this one:
Rep. Marcy Kaptur (D-Ohio) has been passing out maps contending that most states would lose out under the cap-and-trade bill crafted by Energy and Commerce Chairman Henry Waxman (D-Calif.) and Energy and Environment Subcommittee Chairman Ed Markey (D-Mass.).
Multiple requests to her office for confirmation of whether it is the same map were ignored, but Roll Call reporter Steven T. Dennis says it is. So it appears Republicans aren’t the only ones circulating Peabody’s talking points. UPDATE TO THE UPDATE: Kaptur’s spokesperson, Steve Fought, says this is a “case of mistaken maps.” The representative has been handing out two different maps dealing with jurisdictional boundaries of power-marketing authorities, but not this map, Fought says.
UPDATE 2: Closer inspection of the PowerPoint document indicates that Boyce created it originally on September 29, 1998, and it was updated in July 2004 for a “2004 Investor & Analyst Forum.” But it was last edited by an Amelie Hereford on June 17, 2009, and an email address is listed for her at Arch Coal, another coal industry giant. Hereford is a legislative assistant at Arch Coal, according to her LinkedIn profile. Grist called Arch Coal’s corporate offices to confirm, but a receptionist said she did not recognize the name. We’ve dropped her an email requesting comment. Stay tuned. UPDATE TO THE UPDATE: Hereford told Grist she had nothing to do with this map. “Neither Arch Coal, Inc. nor I was involved in the development of the map,” she wrote in an email.
UPDATE 3: Tamara Hinton, spokesperson for the Republicans on the Agriculture Committee, says that the PowerPoint document they are circulating came from the National Mining Association. The association is currently touting the document on the front page of its website, so it’s no big secret who’s distributing these data points. Hinton doesn’t see a problem with circulating the industry’s data. “If the coal industry wants to provide information to show how it will impact people, we’re just letting people know that that information exists,” said Hinton. “There is no conflict of interest.”
More interesting, however, may be the fine print at the bottom of the National Mining Association’s version of the PowerPoint document, which includes an extra page of data. At the bottom of that page is a note that says the document does not accurately reflect the Waxman-Markey legislation as it currently stands. The footnote:
These rough calculations DO NOT represent a precise indicator of the actual allocation of allowances to electricity distribution companies under sections 782 and 783 of the ACES legislation (5-29-2009 version). First, power can and does move across state lines, so the share electricity-related of carbon dioxide emissions associated with power generation within a state may differ from the share of carbon dioxide emissions associated with power sales within that state — it is the latter that is used in the ACES formula as we understand it, but the former that is calculated here. Second, the distribution under ACES is done on a utility-by-utility basis rather than a state-by-state basis, and there can be significant differences across utilities within a given state. Third, these calculations are made based on data for 2006 through 2008 (2008 data is unpublished preliminary data), while the ACES legislation allows the affected electricity sellers the option of choosing a different period within a specified range of dates. Finally, the calculations do not cover many of the detailed legislative provisions dealing with allocation.
UPDATE 4: Luke Popovich, vice president of external communications for the National Mining Association, confirms that the PowerPoint presentation was put together by his organization. He explained that the document appears to come from Peabody because NMA used a template the company created in 2004. But the map and the data it’s based on were produced entirely by NMA staff, he said.
Peabody Energy and Arch Coal are both members of NMA, so in a sense they are indirectly involved. “Did Peabody, the big coal company, have a role in it? Yeah. So did every other coal company that paid us dues,” said Popovich. “But it’s NMA’s math. What it displays are NMA’s calculations. Peabody had nothing to do with those.” Popovich couldn’t explain why Arch Coal’s name would appear in the document’s history.


