 Sharing the bounty of knowledge.Most people attempting to build a viable urban agriculture business are acutely aware of the enormously challenging and time-consuming process of navigating zoning regulations. Having worked in this sector, I can personally testify that the process is tedious and time-sucking. Over the past couple of years, a number of cities such as New York City, San Francisco, Seattle, and Chicago have begun enacting, or at the very least exploring, new regulations. One of the major challenges facing policymakers, however, is identifying effective policies and best practices.
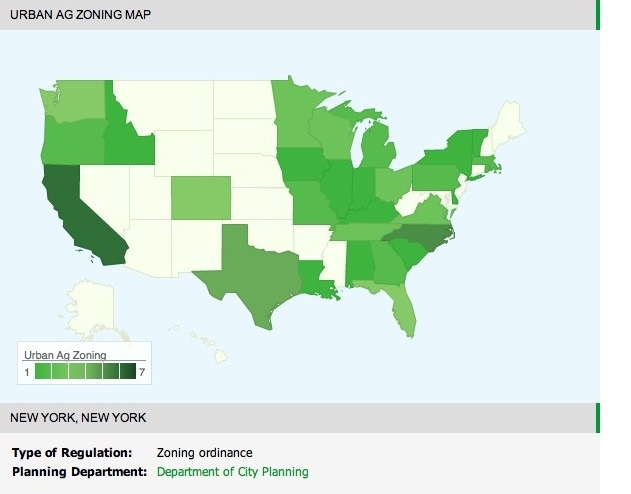
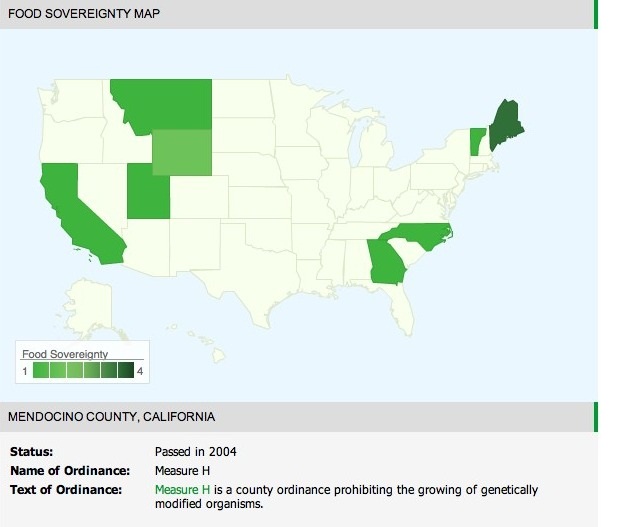
Which is why I got excited when I learned about Washington, D.C.-based John Reinhardt and the urban agriculture zoning and food sovereignty ordinance maps recently launched on his blog Grown in the City. Among other things covered, Reinhardt and his cousin Bob Wall are using technology to help people understand urban agriculture and food sovereignty policy approaches across the United States. Grown in The City’s new iTools column focuses on educating urban agriculturists of all kinds on how they can use open source technology to better communicate food policy and urban planning data, reviews tools, and highlights other resourceful websites.
My interview with Reinhardt gives insight into the maps, why open-source data is crucial for optimizing policy decision-making, and the food and tech trends that he’s most excited about.
 John Reinhardt.Q. How did an urban planner get interested in food and tech?
A. I’ve always been interested in a variety of topics: gardening, food, media, technology, sociology, architecture … I think it’s partly why I became an urban planner (an interdisciplinary profession that potentially touches on all of these topics and more). So, I think a better way to answer your question is that I became interested in urban planning through my interests in food and tech (and everything else related to cities).
Growing up in Staten Island, my family kept a kitchen garden, and this made a huge impression on me. At the same time, four years at a science and tech high school, followed by an undergrad in interdisciplinary humanities and communication gave me all the skills to succeed as an urban planner — which included courses in Geographic Information Systems (GIS), computer graphics, database analysis, and other “techie” things.
It wasn’t until the end of my formal urban planning coursework at Penn that I discovered the burgeoning specialty of food systems planning, through the work of Domenic Vitiello, who guest lectured in a sustainable development class. My interest in the topic led me to start Grown in the City, which sits squarely at the intersection of food systems, urban planning, design, gardening, and policy.
Q. Could you tell us about Grown In The City’s weekly iTools column?
A. The weeky iTools column is a chance to explicitly link the urban agriculture community and the technology community. As I’ve seen over the past few years, many large companies such as IBM, Seimens, and GE are starting to focus on “smart city” technology. At the same time, individuals now have the tools to develop iPhone applications, websites, blogs, and other outlets to share information. iTools is the nexus between the techology, the policy, and the practice.
The column is written by Bob Wall, a veteran programmer, who saw a gap between the users and creators of technology. He’ll be covering a variety of topics — how to integrate open source technology into food policy and planning blogs, reviews of applications that make urban gardening easier, and even highlights of other websites that are using neat technologies (and how they’re doing it). It is hopefully a very empowering column for people who may not have much of a tech background and an eye opener for those who do.
Q. What are your goals with the “Interactive Urban Agriculture Zoning Map” and “Interactive Food Sovereignty Ordinance Map”? Why did you choose mapping as a medium for achieving these goals?
A. The interactive maps were designed to track the urban agriculture zoning and food sovereignty movements. As an urban planner, you learn that how you communicate data is extremely important, and the clean, easy-to-use maps provide immediate visual information (e.g., which states have the most ordinances) while making the information easy to access (just click on your state!). For example, by looking at the Urban Ag Zoning map, you can quickly see that there aren’t many policies in the Rocky Mountain Region. It may inspire people in those states who may want to do some digging on their own to see if the policies exist, or even go as far as to propose them if they don’t.
You could say that this fascination with visually-represented data goes back to my GIS roots, but I think it’s also a really effective way for people who have no real interest in how the technology works to just click on their state and get the info they need. In that respect, I think it straddles both sides of food + tech. We’re currently working on drilling down to the ZIP code level, and up to the global scale, but that’s still some time off.
Q. What does “open source data sharing” mean to you? Why is it important?
A. Open source data sharing means that the data is available for everyone to download, analyze, update, and contribute to. This is extremely important given the high speed of change in technology, and the speed of change in the current world of policy. By keeping the data open source, it can be consistently updated and analyzed to help policy makers make the best decisions possible in real-time.
In addition, by creating a data hub, we hope to help spur creative thinking and foster critical thinking about the policy approaches taken by different state and local governments. Our current maps are not updated in real time and focus as more of a data-hub, but we are looking at ways to push the envelope, and really welcome suggestions for what would make useful tools, maps, and resources.
Q. How are you incentivizing users to contribute data to the maps? What portion of the maps are user-contributed data?
A. We’re hoping that users contribute data because it’s something they really care about, and we’re trying to make it as easy as possible. Users don’t have to register or fill out any complicated forms to submit data. It goes directly into our database system (which is linked to the map), where someone moderates it for quality and accuracy before posting.
Currently, most of the food sovereignty map is user-submitted (we started off with only one local ordinance — Sedgwick, Maine — and the map now includes a dozen or so state and local laws). The urban ag zoning map started from a base dataset, but we’ve had 5-10 new submissions in the week it’s been live.
The urban agriculture/food systems/urban planning community is a very dedicated group (just check out the COMFOOD listserv), so I see Grown in the City’s role as providing easy, well designed, good looking, open source tools for people to share data with.
Q. What excites you the most about the way that tech are being leveraged to affect the food system?
A. I think what excites me most is how the internet functions. We see all the time the internet can be used as a “flashpoint” for transmitting memes — everything from Charlie Sheen to Rebecca Black can become the talk of the town (or the world) overnight. In a smaller, kinder way, I think we’ve seen this with some really interesting urban agriculture stories. The story on Maine food sovereignty has been shared over 1,300 times on Facebook since it was published 10 days ago and was even picked up by Mark Bittman of The New York Times. In that respect, I think new technologies are an incredible media tool for telling the stories we all care about so passionately to a wider audience.
In terms of how we are using technology? Tools such as smart phones, which seem to be in the hands of everyone these days, can be used to collect more and better data about our food system in relatively non-intrusive ways. Just think if everyone was entering information about how much and what type of produce they consumed, how much water they used to water their gardens, or what they were growing in their community gardens? Having such data would allow us to get a much clearer picture of the local food systems around us and what our impacts are. But I think it’s not too far off, given the new tools we’re seeing.
I think the future is one where technology, metrics, and real-time measurement of our impacts are just part of daily life. Whether this is good or bad remains to be seen, but it sure is interesting!
