The melting of the Arctic has been so gradual and far-off it’s hard to comprehend the huge amount of ice that has vanished. But with this NASA visualization, seeing the disintegration of the polar region is as easy as reading an eye chart with 20/20 vision.
NASAClick to embiggen.
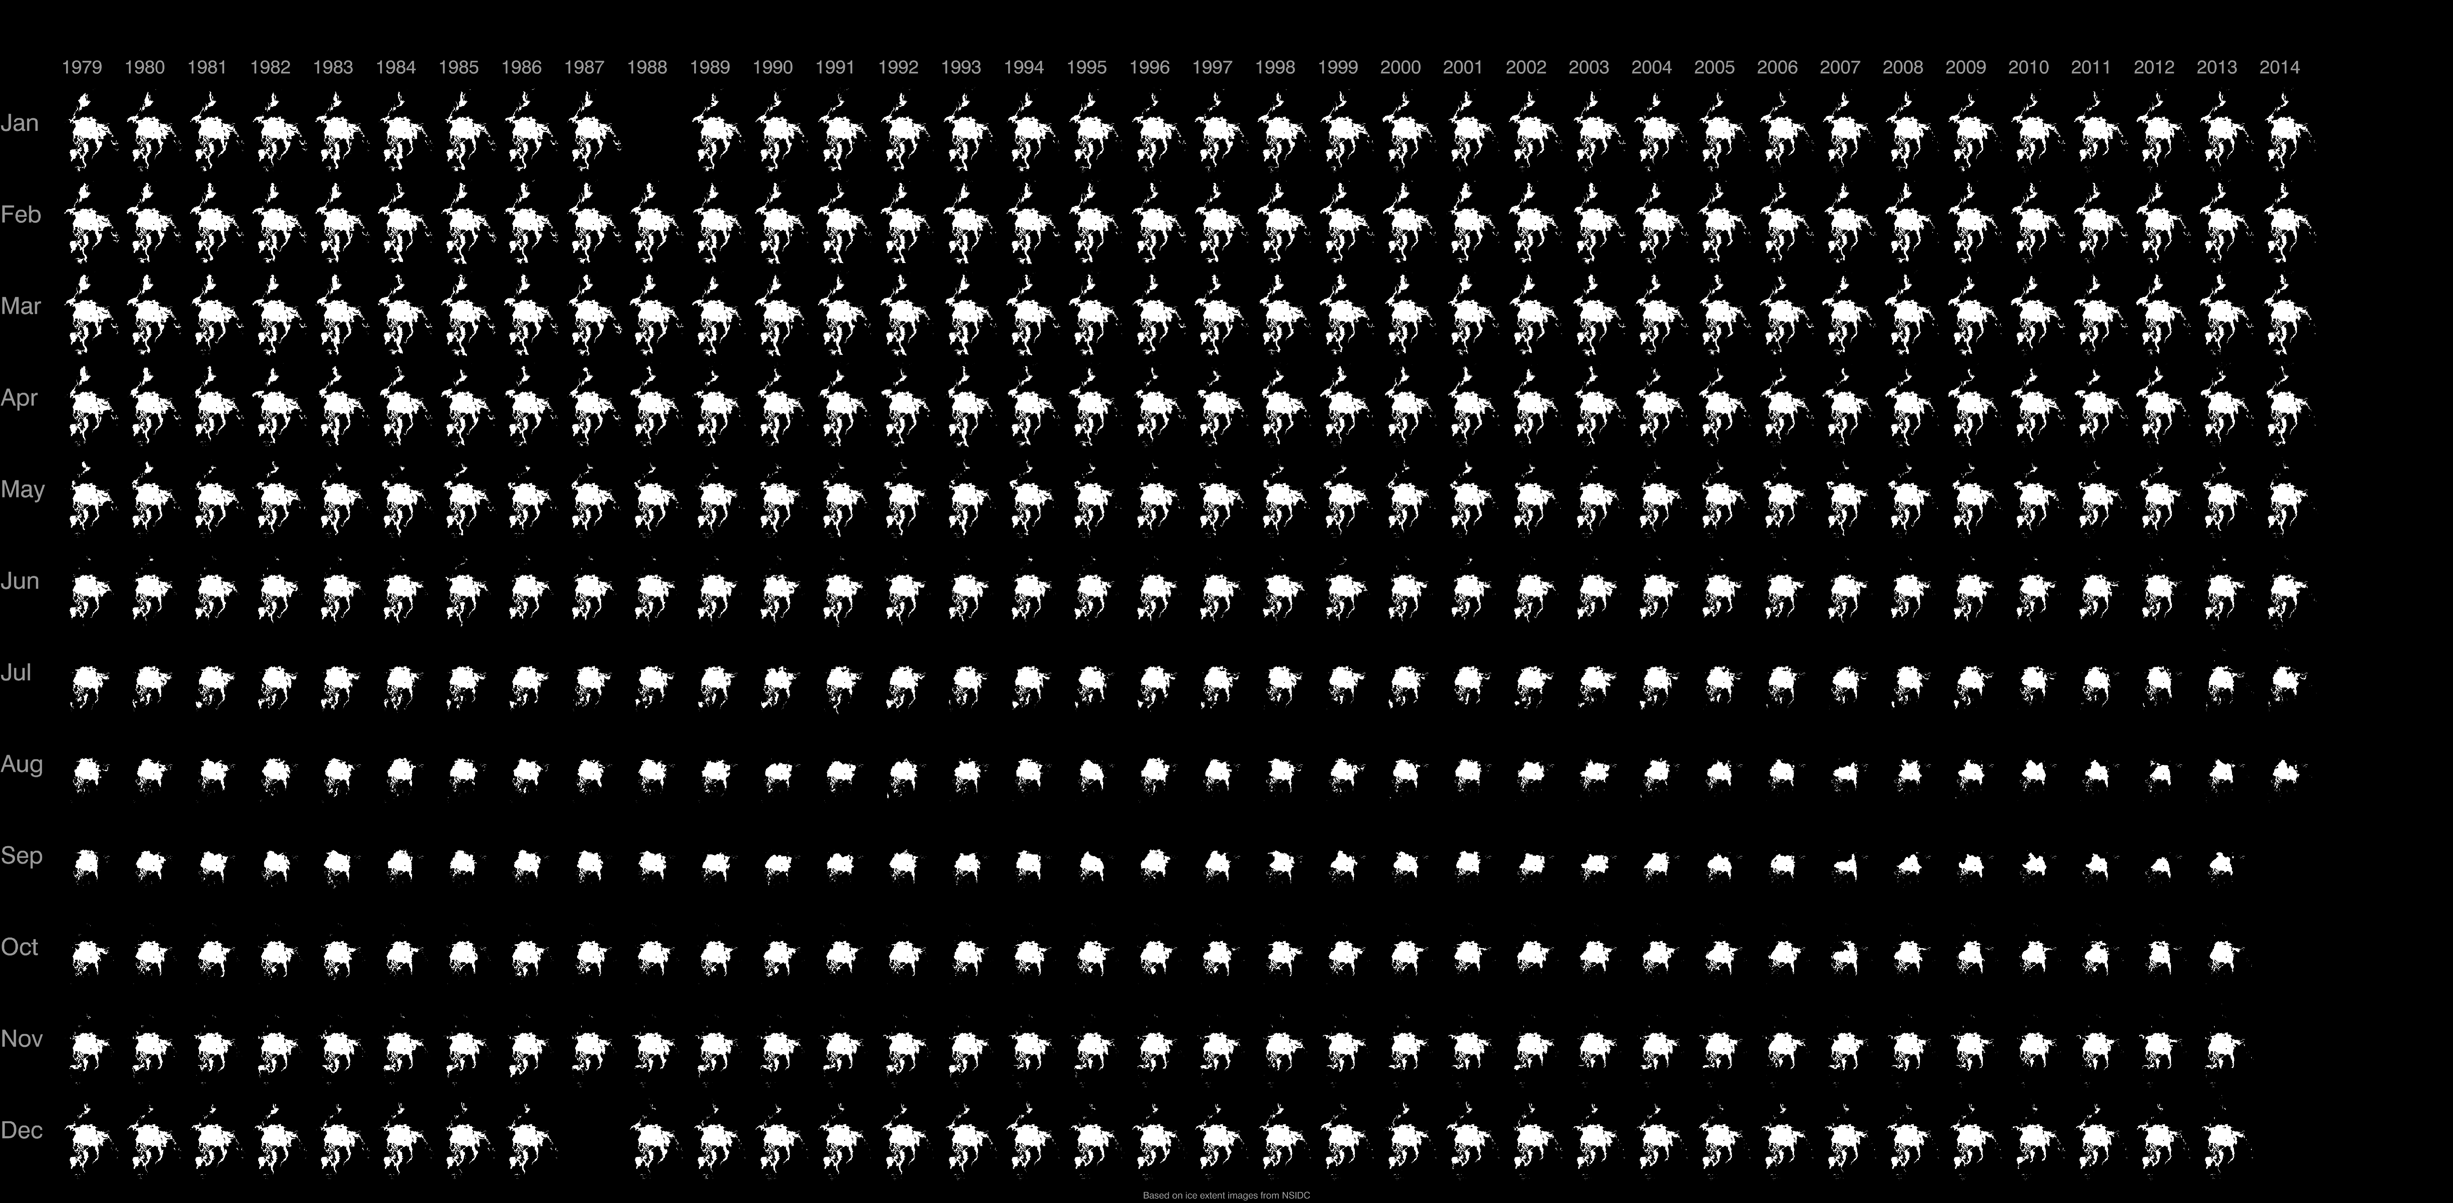
The graphic shows Arctic sea-ice extent for most months dating back to the late 1970s, based on images from the National Snow and Ice Data Center. Years run across the top, months are plotted downward. “By glancing at the image, the viewer can quickly see the periods during the year when North Pole sea ice extent is at minimum and maximum,” writes NASA. “It is also easy to see how the sea ice has changed over the years.”
Though there are fluctuations in the ice, the grand pattern (especially pronounced during summer months) is one of steady shrinking. This year’s minimum annual sea-ice extent of 1.9 million square miles, which occurred on Sept. 17, was the sixth-smallest since satellite record-keeping began. It doesn’t sound so terrible when compared with the smallest extent ever measured: 1.3 million square miles in 2012. But when set against the average historic minimum of 2.4 million square miles, it’s easy to see why researchers expect the Arctic to be ice-free during summertime well before the century ends.
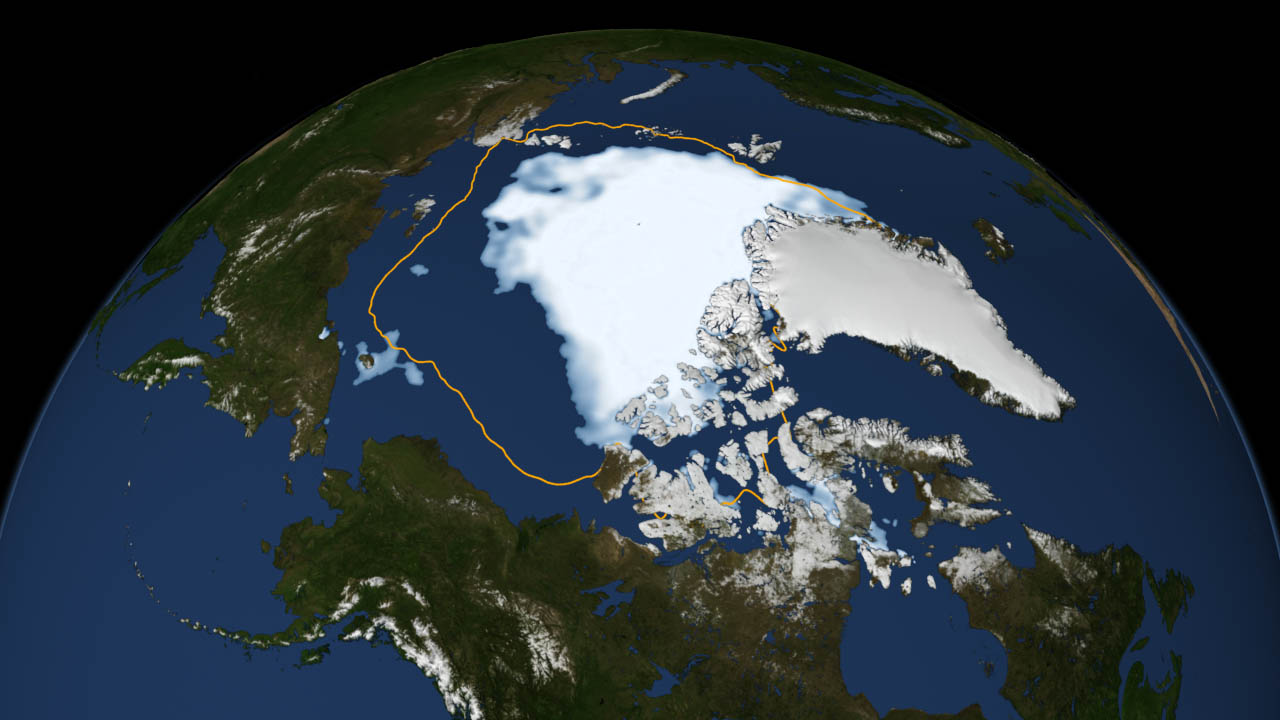
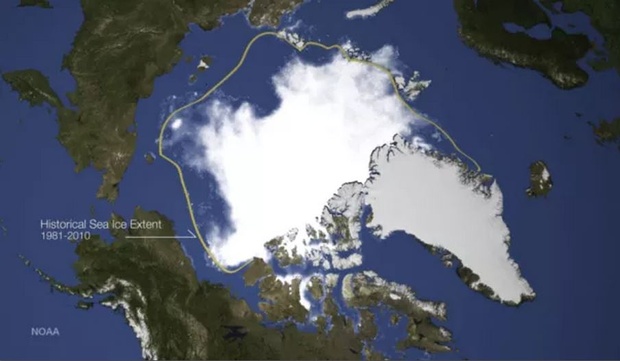
The frigid dissolution, which the NSIDC calls “one of the most visible indicators of our changing climate,” is worrying news as the ice plays a big role in reflecting solar radiation away from the planet. With less of it covering the ocean, the Northern Hemisphere will likely heat up quicker, hastening our arrival to the days of dangerously high sea levels. For a different look at the disappearing Arctic ice, here is a satellite’s-eye view of this year’s minimum extent compared to the historic median (the yellow line):
This story was produced by CityLab as part of the Climate Desk collaboration.