For millennia, humans have harnessed rivers, built dams, and dug wells to quench our growing civilization. Now, for the first time, we have a picture of what all those generations have wrought on our blue planet’s most defining resource.
Newly analyzed data from groundwater-detecting satellites “reveals a clear human fingerprint on the global water cycle,” according to a study out Wednesday in the journal Nature. It’s the kind of result that is equal parts terrifying and long-expected in its implications.
“We know for sure that some of these impacts are caused by climate change,” says lead author Matt Rodell, chief of the Hydrological Sciences Laboratory at NASA. “We are using huge parts of the [Earth’s] available water.”
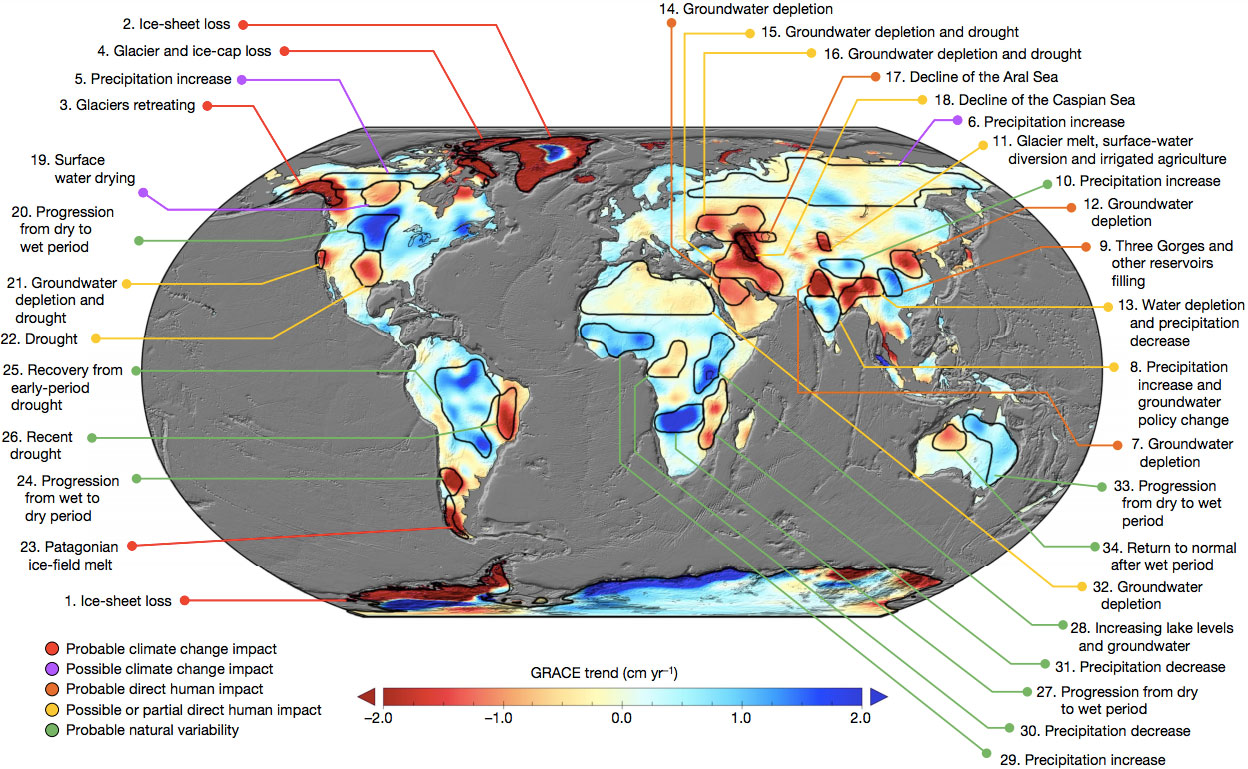
The authors used the satellite data to construct a map of 34 rapidly changing regions around the world, painting a unified picture of current hot spots of water scarcity and excess. Nearly every activity that involves people requires water — rice farming, nuclear power, aluminum smelting, you name it — so the lives of people living where reserves are being rapidly depleted are under grave threat.
“The resulting map is mind-blowing, and has staggering implications for water, food, and human security that we are just not aware of or prepared for,” says study co-author Jay Famiglietti, a water scientist at NASA’s Jet Propulsion Laboratory. “We are very literally seeing all of the hotspots for climate change, for changing extremes of flooding and drought, and for the impact of human water management define themselves.
“Our future challenges could not be more clear from looking at this map.”

Rodell et al, 2018
The map offers a powerful first glimpse of what climate change and over-exploitation of water resources looks like — a “global pattern of freshwater redistribution, due to climate change,” according to Famiglietti. It’s stark, visual evidence that the way humans use water is unsustainable.
The study’s authors took 14 years of data from NASA’s Gravity Recovery and Climate Experiment (GRACE), which measures minute fluctuations in the Earth’s gravitational field as water moves around the planet. They then tried to track down the root causes of the biggest changes they found — an analysis that took eight years to complete. In two-thirds of the cases, the researchers discovered a direct link to human activity. And in some of those, especially in remote regions of southern Africa and China, the colossal scale of the shifts was previously unknown.
The footprints left behind by massive feats of engineering are also visible in the new map. You can see the consequences of the filling of major reservoirs, like the one bound by the massive Three Gorges Dam in China, of the diverted rivers in India, and of the exploitation of the High Plains aquifer in the central United States for agriculture. Long-predicted climate shifts are also apparent, such as the rapid warming and moistening of the Arctic, melting ice in mountain glaciers, and increasingly extreme cycles of droughts and floods.
To be sure, there are drawbacks to this study, says Kate Brauman, a water researcher at the University of Minnesota who was unaffiliated with the research. The main problem is related to the fact that the GRACE satellite’s output is not very geographically specific.
“Relatively small changes in weather make a big difference” on the huge regions the study covers, says Brauman. She says the method the authors used identifies only large-scale changes — roughly the size of Kansas or larger. That’s too coarse a view to spot individual water-wasters, but it’s possibly accurate enough to raise hope for monitoring and governing previously untracked and unregulated large-scale abuses.
The next generation of GRACE satellites, launching on Saturday, should provide additional evidence of exactly how humans are altering the planet’s water cycle, and with more accuracy. And in another 15 years or so, Rodell says, his team should be able to draw even bolder conclusions about exactly which parts of the world are being affected most by shifts in rainfall and changing water policies.
For Famiglietti, the research was life-changing. The work inspired him to leave his job at NASA for a role at the University of Saskatchewan studying “the forces that drive water insecurity in the major hotspots revealed by this map.” A year from now, Famiglietti hopes to be working to assemble local groups around the world focused on water conservation in each of the affected regions. For him, the message behind the data is clear: It’s time to act.


