Discussions of CO2 reduction tend to start from a presumption of near-term economic disruption coupled to long-term investment in green technology. The presumption isn’t right. The U.S. could reduce its total CO2 footprint by 14-20 percent tomorrow with no disruption in our access to energy services, without investing in any new infrastructure. The Waxman-Markey proposal to reduce CO2 emissions by 17 percent over 10 years is constrained only by its ambition.
This near-term opportunity would be realized by ramping up our nation’s generation of electricity from gas and ramping down our generation from coal, taking advantage only of existing assets. Its scale and potential for immediate impact deserves consideration; even partial action towards this goal would have dramatic political and environmental consequences, establishing U.S. leadership and credibility in global climate negotiations.
Understanding the Natural Gas Potential
About half of U.S. electricity is produced from coal while roughly 20 percent comes from gas. However, this comes from a very different installed base. The U.S. coal fleet runs base-loaded as much as it can while the gas fleet tends to run intermittently, only during those hours when the lower cost coal/nuclear/hydro capacity is unable to serve the full needs of the electric grid.
Thus, even though coal is more significant than gas in terms of its current contribution to our electricity needs, the existing gas fleet has a much larger potential to meet future needs.
 U.S. Installed Coal and Gas Generation Capacity, 1976-2007.
Today’s gas fleet was largely built out after the electric regulatory reforms of the late 1990s – and to a significant degree, we don’t use it. The following chart shows the capacity factor[1] of the gas and coal fleets. While the coal fleet tends to run, and run often, the gas fleet does not.
 U.S. Natural Gas and Coal Fleet Capacity Factors, 1976-2007
Therein lies the potential. A driver stuck in traffic may glance enviously at an empty commuter train buzzing past the highway; likewise, we ought to take a closer look at the potential to shift our electricity away from a dirty, congested and comparatively small resource and into one that is larger, cleaner and comes with a lot more legroom.
Economic Considerations
Why doesn’t the gas fleet run more often? This simple answer is fuel price. Natural gas has historically been more expensive than coal, giving an economic advantage to coal fired generators.
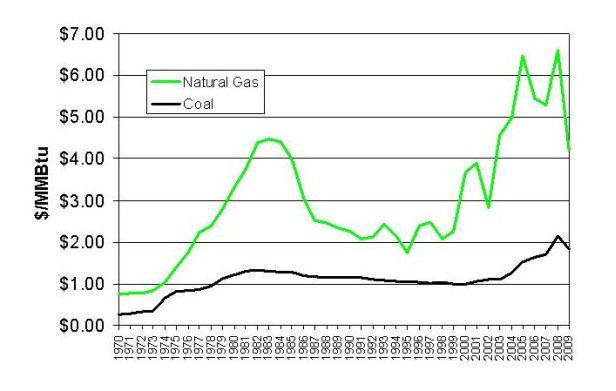 U.S. Natural gas and Bituminous Coal Spot Prices, 1970 – 2009, $/MMBtu basis (chained to year 2000 USD).
However, the price of fuel isn’t the price of electricity. Electric price is a strong function of fuel cost, but also depends on operating costs and fuel conversion efficiencies. Fuel conversion efficiencies tend to be higher for gas plants relative to coal — and this advantage is growing with time, steadily eroding the coal fleet’s fuel cost advantage.
 U.S. Natural Gas and Coal Fleet Fuel Efficiency, 1989-2008. See footnote [2]
The units on this chart are unconventional, but intentional. The costs of gas and coal production are a function of production volumes rather than the MMBtus. contained therein. Thus, the economics of power plant operation scale with output per fuel volume more strongly than output per fuel Btu. Over short time periods, the energy content of any given fuel tends to be fairly consistent, so this point is irrelevant. However, longer-term trends have been affecting coal energy contents in material ways.
As Richard Heinberg[3] has shown, the heat content of delivered coal in the U.S. has been falling steadily since the 1950s. This has been driven by two factors: (1) the exhaustion of higher-Btu, eastern coal fields and (2) the increasing preference for lower-sulfur, lower-Btu compliance coals in response to environmental pressures.
 Heat value decline of U.S. Coal, 1955-2005
In addition, parasitic power demands imposed by mandated pollution control devices on the coal plants themselves have reduced net efficiencies for affected coal plants by a further 3 – 7 percent. Taken together, these parasitic loads and falling fuel value explain the degradation in coal plant efficiency.
Meanwhile, the gas fleet efficiency keeps rising. This has been driven not by fuel, but technology.
Broadly speaking, the U.S. gas fleet consists of three distinct technologies: (1) Steamers – gas-fired boilers and steam turbines; (2) Turbines – jet engines, converted to electric generation Use and exhausting hot gas, and (3) Combined Cycle Gas Turbines – a combination of the two, where the hot gas from a turbine is used to raise steam and run a steam turbine. Combined cycles are by far the most efficient of the three technologies, and were the preferred technology in the late 1990s fleet build-out observed in Figure 1.
In upcoming years, the coal fleet is likely to get ever-less efficient as the inexorable bias towards lower-quality coal and tighter environmental standards continue. Meanwhile, the gas fleet is likely to become ever-more efficient; absent new construction, these plants will increase their output with demand growth (and possibly, picking up load previously served by coal), and they tend to have lousy part-load efficiencies. Thus, as they operate at higher load factors, they consume less fuel per MWh. Moreover, as the gas fleet ramps up, it will preferentially favor combined cycles — the most efficient part of the fleet.
 2008 U.S. Natural Gas Electric Fleet Capacities.
However, the combined cycles are today running at only 35 percent capacity factor.
 2008 U.S. Natural Gas Electricity Generation.
Given a 35 percent current capacity factor on 223 GW of capacity, this implies the potential to produce an additional 1.3 million GWh/year from the existing combined cycle fleet. The heat rate on this fleet — 7,434 Btu/kWh in 2008 — is likely lower on the margin, due to the aforementioned efficiency penalties at partial load.
How does this compare to the coal fleet? The following chart shows the fuel efficiency of each plant in the U.S. coal fleet, ranked from highest to lowest. Note that the most efficient coal plant in the country has a heat rate of 9,100 Btu/kWh — meaning that the plant consumes 2,000 more Btus of fuel for every kWh of output than the combined cycle gas turbine fleet. The rest of the coal fleet is worse.
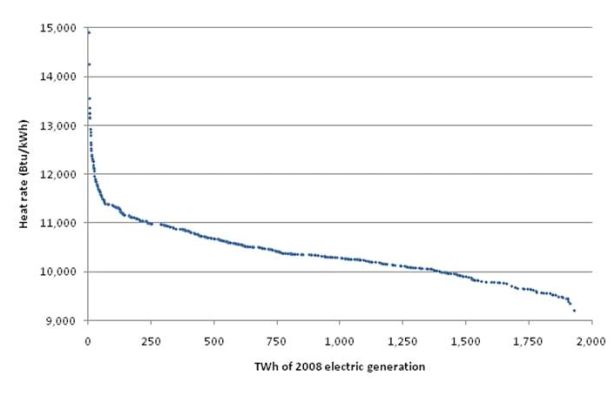 2008 U.S. Coal Fleet Heat Rates (Electric-only).
If we increased the operation of our combined cycle fleet, we would first turn off the least efficient coal plants at nearly 15,000 Btu/kWh, then sequentially idle more efficient facilities. CO2 emissions would fall as a function of the (fixed) differential in fuel carbon content and (variable) differential in the efficiency of each marginal generating station.
Now look at what this means for electricity price. Figure 5 uses the fuel price history from and calculates the electricity-generation cost given a 7,100 Btu/kWh marginal heat rate on the combined cycle fleet and an 11,500 Btu/kWh marginal heat rate on the coal fleet. (The higher value on the coal fleet is to reflect the vulnerable coal plants on the margin; it is not representative of the entire fleet, but rather to indicate the point at which — on fuel price alone — there is an economic logic to drive a shift in the dispatch order.)
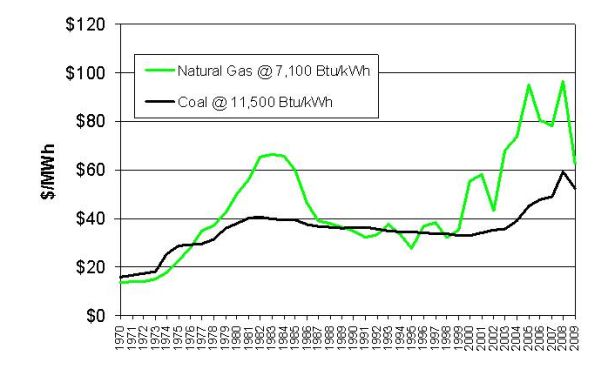 Bituminous. Coal and Natural Gas Marginal Generation Costs, 1970 – 2009 (chained to year 2000 U.S.D)
Note first that during the early/mid 1990s, there was a long period during which — had the combined cycle fleet existed — it would have been dispatched preferentially ahead of the marginal coal fleet. This further explains the explosion in gas fleet construction in the latter half of that decade; not only were markets finally liberalized to allow greater private sector investment, but investors had reason to believe that there was an arbitrage opportunity from those combined cycles. Subsequent gas price spikes left many of those assets underutilized, but the fleet is now there, capital costs sunk, waiting for another arbitrage opportunity. The opportunity may be upon U.S., even before any consideration of CO2 pricing.
CO2 prices could well prove to be the final straw. The following chart shows the CO2 price required to shift the dispatch over a range of gas and coal prices.
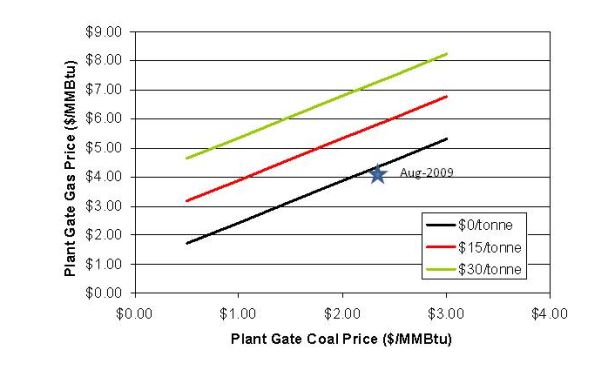 CO2 prices required to achieve breakeven coal/gas plant marginal dispatch economics. See footnote [4]
Note that at current gas/coal prices, we are already at that breakeven point. Moreover, even if gas returns to the $5 – 6/MMBtu price implied by current NYMEX futures, a carbon price of less than $20/ton would shift the dispatch decisively towards natural gas-fired generation.
Environmental Considerations
Let us now look at the environmental consequences. On a fuel-basis, natural gas is approximately 60 percent as CO2 -intensive as coal.[5] Once differential generation efficiencies are factored in, electricity from natural gas is just ~40 percent as CO2 -intensive as electricity from coal.
Note, however, that the CO2 benefit per MWh from natural gas is a function of the relative efficiency of the marginal coal and gas units coming on/off line — and as we have seen, that efficiency is not a consistent number for either fleet. As it turns out, fully shutting off the U.S. coal fleet would require fully utilizing our entire combined cycle fleet and increasing the operation of a portion of the less efficient gas generators.
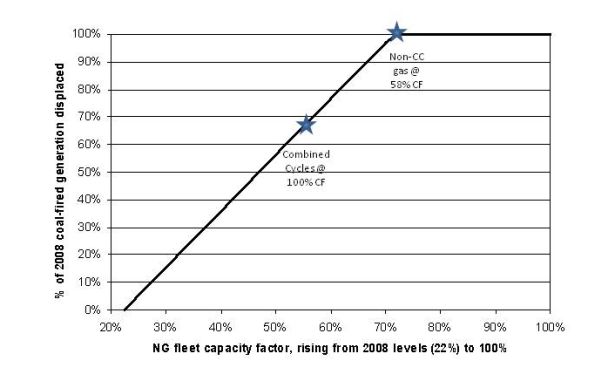 Potential for Existing Natural Gas Fleet to Displace Existing Coal Fleet (2008 data)
Fully utilizing the existing combined cycle fleet would idle almost 70 percent of the existing U.S. coal fleet — in itself, a remarkable potential. To shut down the entire coal fleet, we would also have to increase the capacity factor of the rest of the gas fleet to 58 percent, bringing the entire gas fleet up to a 72 percent capacity factor (about where the coal fleet is today).
The following chart shows the percent reduction in total annual U.S. CO2 emissions that would accrue from this switch. These calculations have been done on a dispatch basis, such that each incremental MWh switched has a lower net CO2 benefit, as incrementally less efficient gas displaces incrementally more efficient coal.
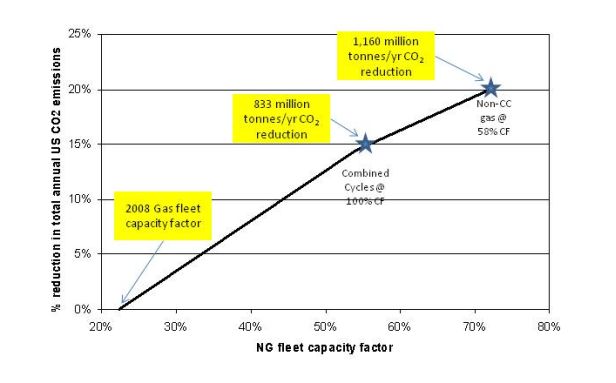 Immediate potential reduction in U.S. CO2 emissions from change in gas/coal dispatch order.
These values are staggering. Ramping up the existing combined cycle fleet to full capacity would reduce total U.S. CO2 emissions by 14 percent. Increasing the capacity factor of the less efficient portions of the fleet up to the level required to shut off all the nation’s coal plants would reduce total U.S. CO2 emissions by a whopping 20 percent. These reductions could be accomplished tomorrow, practically with the flip of a switch, and immediately call into question the ambition of current regulations seeking a 17 percent reduction over 10 years.
Context: the entire U.S. electric sector releases 2.2 billion metric tonnes/year of CO2 . Simply changing the dispatch order of our existing fleet could instantly cut these emissions in half. Is there any other near-term opportunity of this scale? To be sure, there are a host of practical considerations with this shift, but even if only half this opportunity is available, it massive.
More context: Pacala and Socolow have estimated that we need to reduce CO2 emissions by 25.9 gigatonnes (“Gt”) per year in order to stabilize atmospheric CO2 concentrations at 500 ppm — the upper end what most climate scientists agree to be safe. They break this up into 7 equal chunks of 3.7 Gt/yr each to help conceptualize a series of more manageable “wedges”.[6] For example, doubling the fuel efficiency of every vehicle in the world would yield one wedge, bringing us 1/7th of the way towards our necessary goals. This gas/coal switch, at 1.1 Gt/yr would facilitate about 1/3 of a wedge. Not the whole solution by far, but a very significant, comparatively simple step towards solving a massive global problem — and one that could likely be replicated to varying degrees in any other country with a mix of gas- and coal-fired generation assets.
Limitations and Areas of outstanding uncertainty
This opportunity is clearly subject to constraints beyond the simple size and power output of the gas and coal fleet.
Gas Supply
The U.S. power sector today consumes 6.6 quadrillion Btus (“quads”) of natural gas per year, out of a total, economy-wide gas demand of 23.3 quads/year. Fully shutting down the entire U.S. coal fleet and replacing with gas would increase the power sector as demand by another ~16 quads/year, increasing total U.S. gas demand by 71 percent.
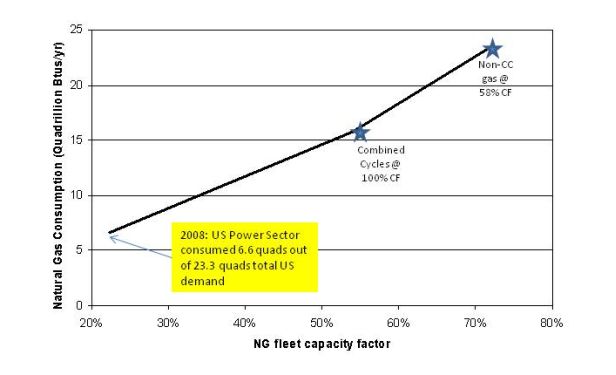 Impact of gas/coal dispatch switch on U.S. Natural Gas Consumption
This raises obvious questions about gas supply and price. Such questions are particularly resonant in light of the recent shale developments that have drastically increased U.S. proven gas reserves and — according to their supporters — changed the dynamics of gas exploration in ways that could affect gas price and volatility. Whether these predictions materialize or not, it is clear that any gas/coal shift will ultimately be constrained by gas price and supply. At a minimum, this suggests that we may be in the midst of a transition; prior to the 1990s, gas prices tended to correlate with oil, as one swapped out the other as a heating fuel. That relationship has broken down in recent years — might we be entering a period in which the gas/oil arbitrage is replaced by a gas/coal + CO2 price arbitrage? In any event, supply constraints are no reason not to start this switch; they simply set limits on how far we can go.
Gas and Electric Transmission Constraints
Hawaii has no electrical connection to the mainland, and is unlikely to get one anytime soon. Hawaii also has no gas fired generation, although they do have some coal. It’s a fairly safe bet that we will never ramp up gas-generation in the lower 48 sufficient to shut down Hawaii’s coal fired power plants.
For similar, but less obvious reasons, those parts of the country that are heavily dominated by gas or coal generation will not be able to fully effectuate this switch without compromising electric power availability, absent upgrades in transmission capacity. Fully quantifying this limit requires a detailed analysis of the electric power grid that is beyond the purview of this analysis. However, as a first approximation, consider the following map of the U.S., ranking states only by the ratio of their gas:coal generation capacity. A high ratio (the blue states) implies that the state is dominated by gas, and therefore likely to run into overvoltage problems if they increased local gas generation. By contrast, a very low ratio (the black states) implies that the state is dominated by coal, and therefore unlikely to be able to bring in gas-fired generation to maintain grid stability if they were to shut down their coal plants.
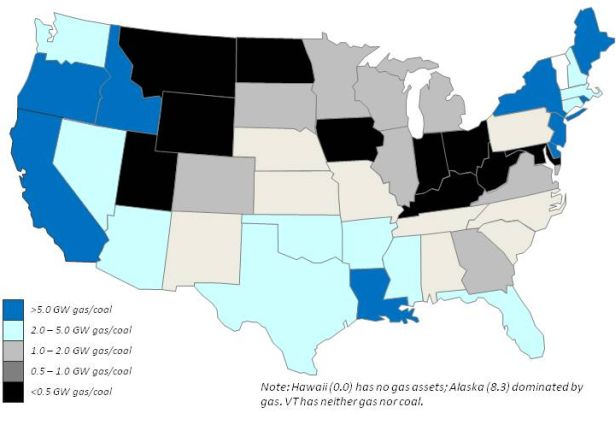 Installed Gas Capacity / Installed Coal Capacity, by State.
A gas/coal switch is unlikely to be realized in the coal-dominated Appalachian / Montana-Utah region, nor in the gas dominated Northeast / California regions, but for much of the country, it does appear viable. Interestingly, the states with a particularly high coal- or gas- concentration comprise a fairly small fraction of the total coal fleet.
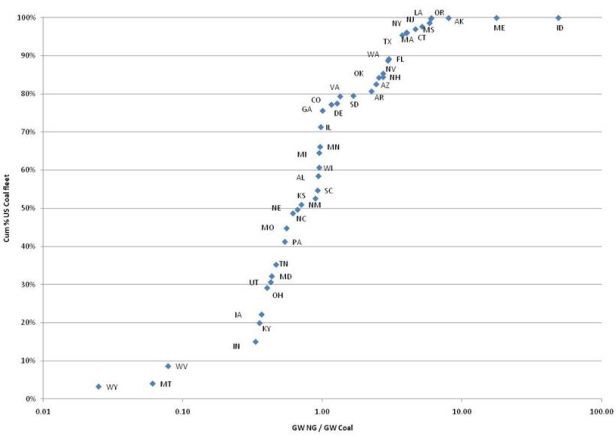 Cumulative percent of U.S. Coal Fleet as a function of State Natural Gas / Coal GW Ratio.
There are relatively few states with extreme concentrations of coal or gas, and in total, those outliers represent less than 20 percent of the total coal fleet. The U.S., it would appear on first glance that gas and electric transmission constraints are unlikely to reduce this opportunity by more than 20 – 30 percent — and even that limit could theoretically be addressed with transmission system upgrades.
Long-Term & Demand Considerations
There are two obvious. limitations of this analysis:
1. It does not address the question of what we will build in response to carbon pricing, only how we will change our operation of existing assets.
2. It is a supply side assessment, and one that implicitly assumes no change in current demand for electricity.
Both constraints are imposed by the nature of the question asked and certainly can affect these conclusions. Both are likely addressed by greater efficiency, both with respect to more efficient new generators (the lowest cost source of new generation) and with respect to demand side measures that would lower the total demand, potentially allowing us to retire the coal fleet more quickly.
Political constraints
This may be the most important. The current climate debate has again proven the political aphorism that “losers cry louder than winners cheer”. As E&E Daily reports, coal-fired utilities spent $35.1 million lobbying Congress in the first quarter of 2009 alone, while the entire gas industry spent just $3.3 million during the same period.[7] (Indeed, the gas industry trade associations have publicly all but conceded that they were a non-player during the Waxman-Markey negotiations.)
This political reality is unlikely to change. The coal industry knows exactly how much they stand to lose, and can be expected to play an appropriately aggressive defensive strategy. This will surely lead to any number of carve outs and protections on a federal and local level that will limit the ability of this shift to occur.
Conclusions
This review is far from exhaustive, and in no way intended to suggest that a silver-bullet for climate policy. The long-term stability of our climate demands massive success on multiple fronts given the size of our collective environmental footprint. However, the potential for this gas/coal switch to immediately lower CO2 emissions is larger than any other near term solution short of more economically-objectionable reductions in people’s access to energy. On that basis alone, it deserves attention.
[1] Total actual annual generation divided by (generator nameplate x 8760 hours/year). All raw data for this and subsequent data comes from DOE / Energy Information Administration unless otherwise noted.
[2] Natural gas data prior to 1989 omitted due to inconsistent EIA reporting of behind-the-fence generation.
[3] Heinberg, Richard, “The Future of Coal”, November 17, 2008.
[4] At 11,500 Btu/kWh marginal coal plant, 7,100 Btu/kWh marginal gas plant
[5] ~115 lbs/MMBtu for natural gas vs. ~200 lbs/MMBtu for coal
[6] Pacala S., and R. Socolow, “Stabilization Wedges: Solving the Climate Problem for the Next 50 Years with Current Technologies”, Science, vol 305, August 13, 2004. Pacala & Socolow measure their units in Gt of carbon, rather than CO2 (1 ton C = 3.7 tons CO2 ), and therefore frame their wedges in terms of 7 Gt/year total reduction, 1 Gt/yr per wedge. Units here have been multiplied for more direct comparison with the rest of the calculations herein.
[7] http://www.eenews.net/public/Greenwire/2009/07/13/1
